Dashboard
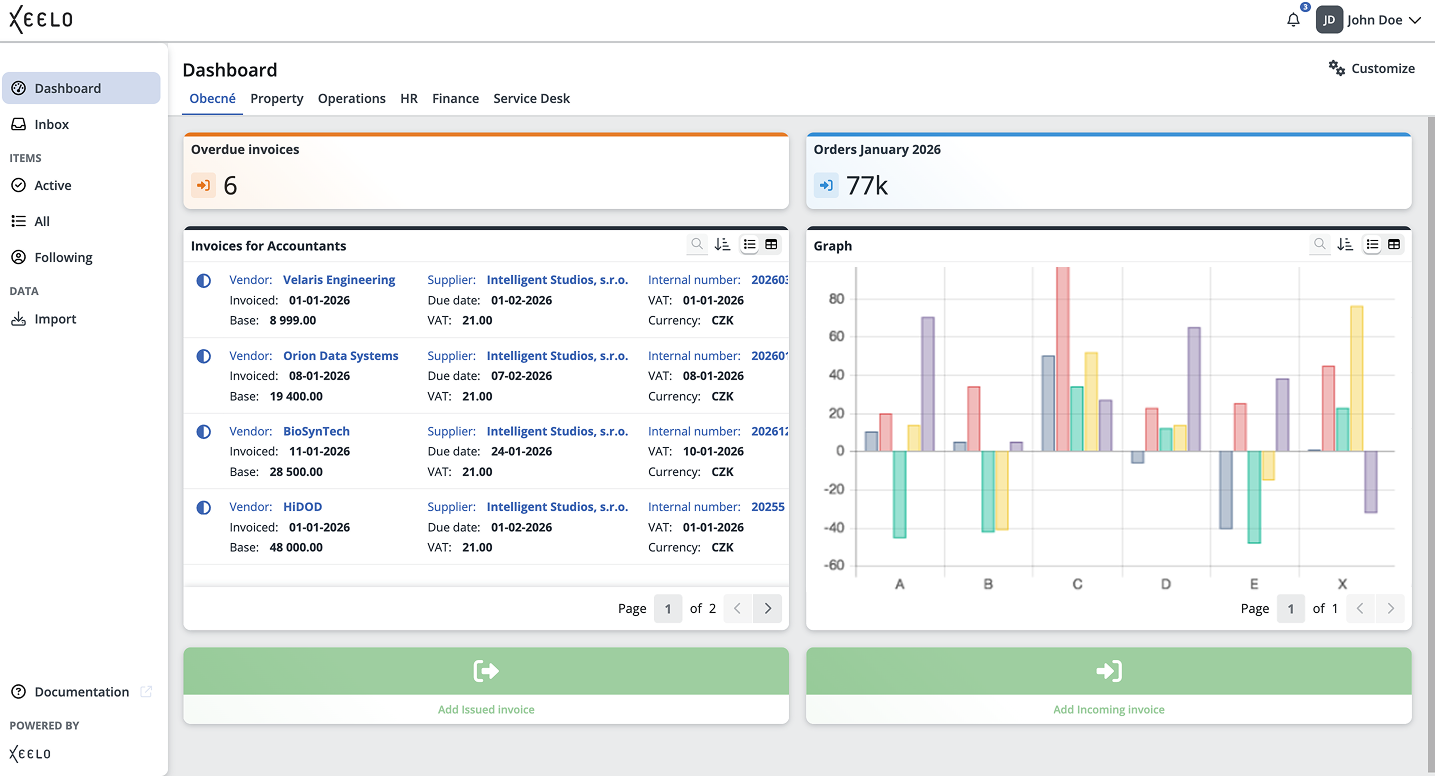
The Dashboard serves as your personal workspace. You can customize it according to your needs and focus on the information that is most important for your role. With widgets, you can easily monitor request statuses, access data, or quickly create new records.
You can create as many dashboards as you need — for example, based on different topics, projects, or team roles. Each dashboard is displayed as a separate tab, and the tab order can be easily adjusted when needed.
Creating a new dashboard
The Dashboard is available from the side menu. If you set it as your default page in the My Profile section, it will open automatically after you sign in. You can return to it at any time by clicking the application logo in the upper-left corner (Home button).
If you do not have any dashboard created or subscribed yet, an empty workspace is displayed with the options Create New and Subscribe.
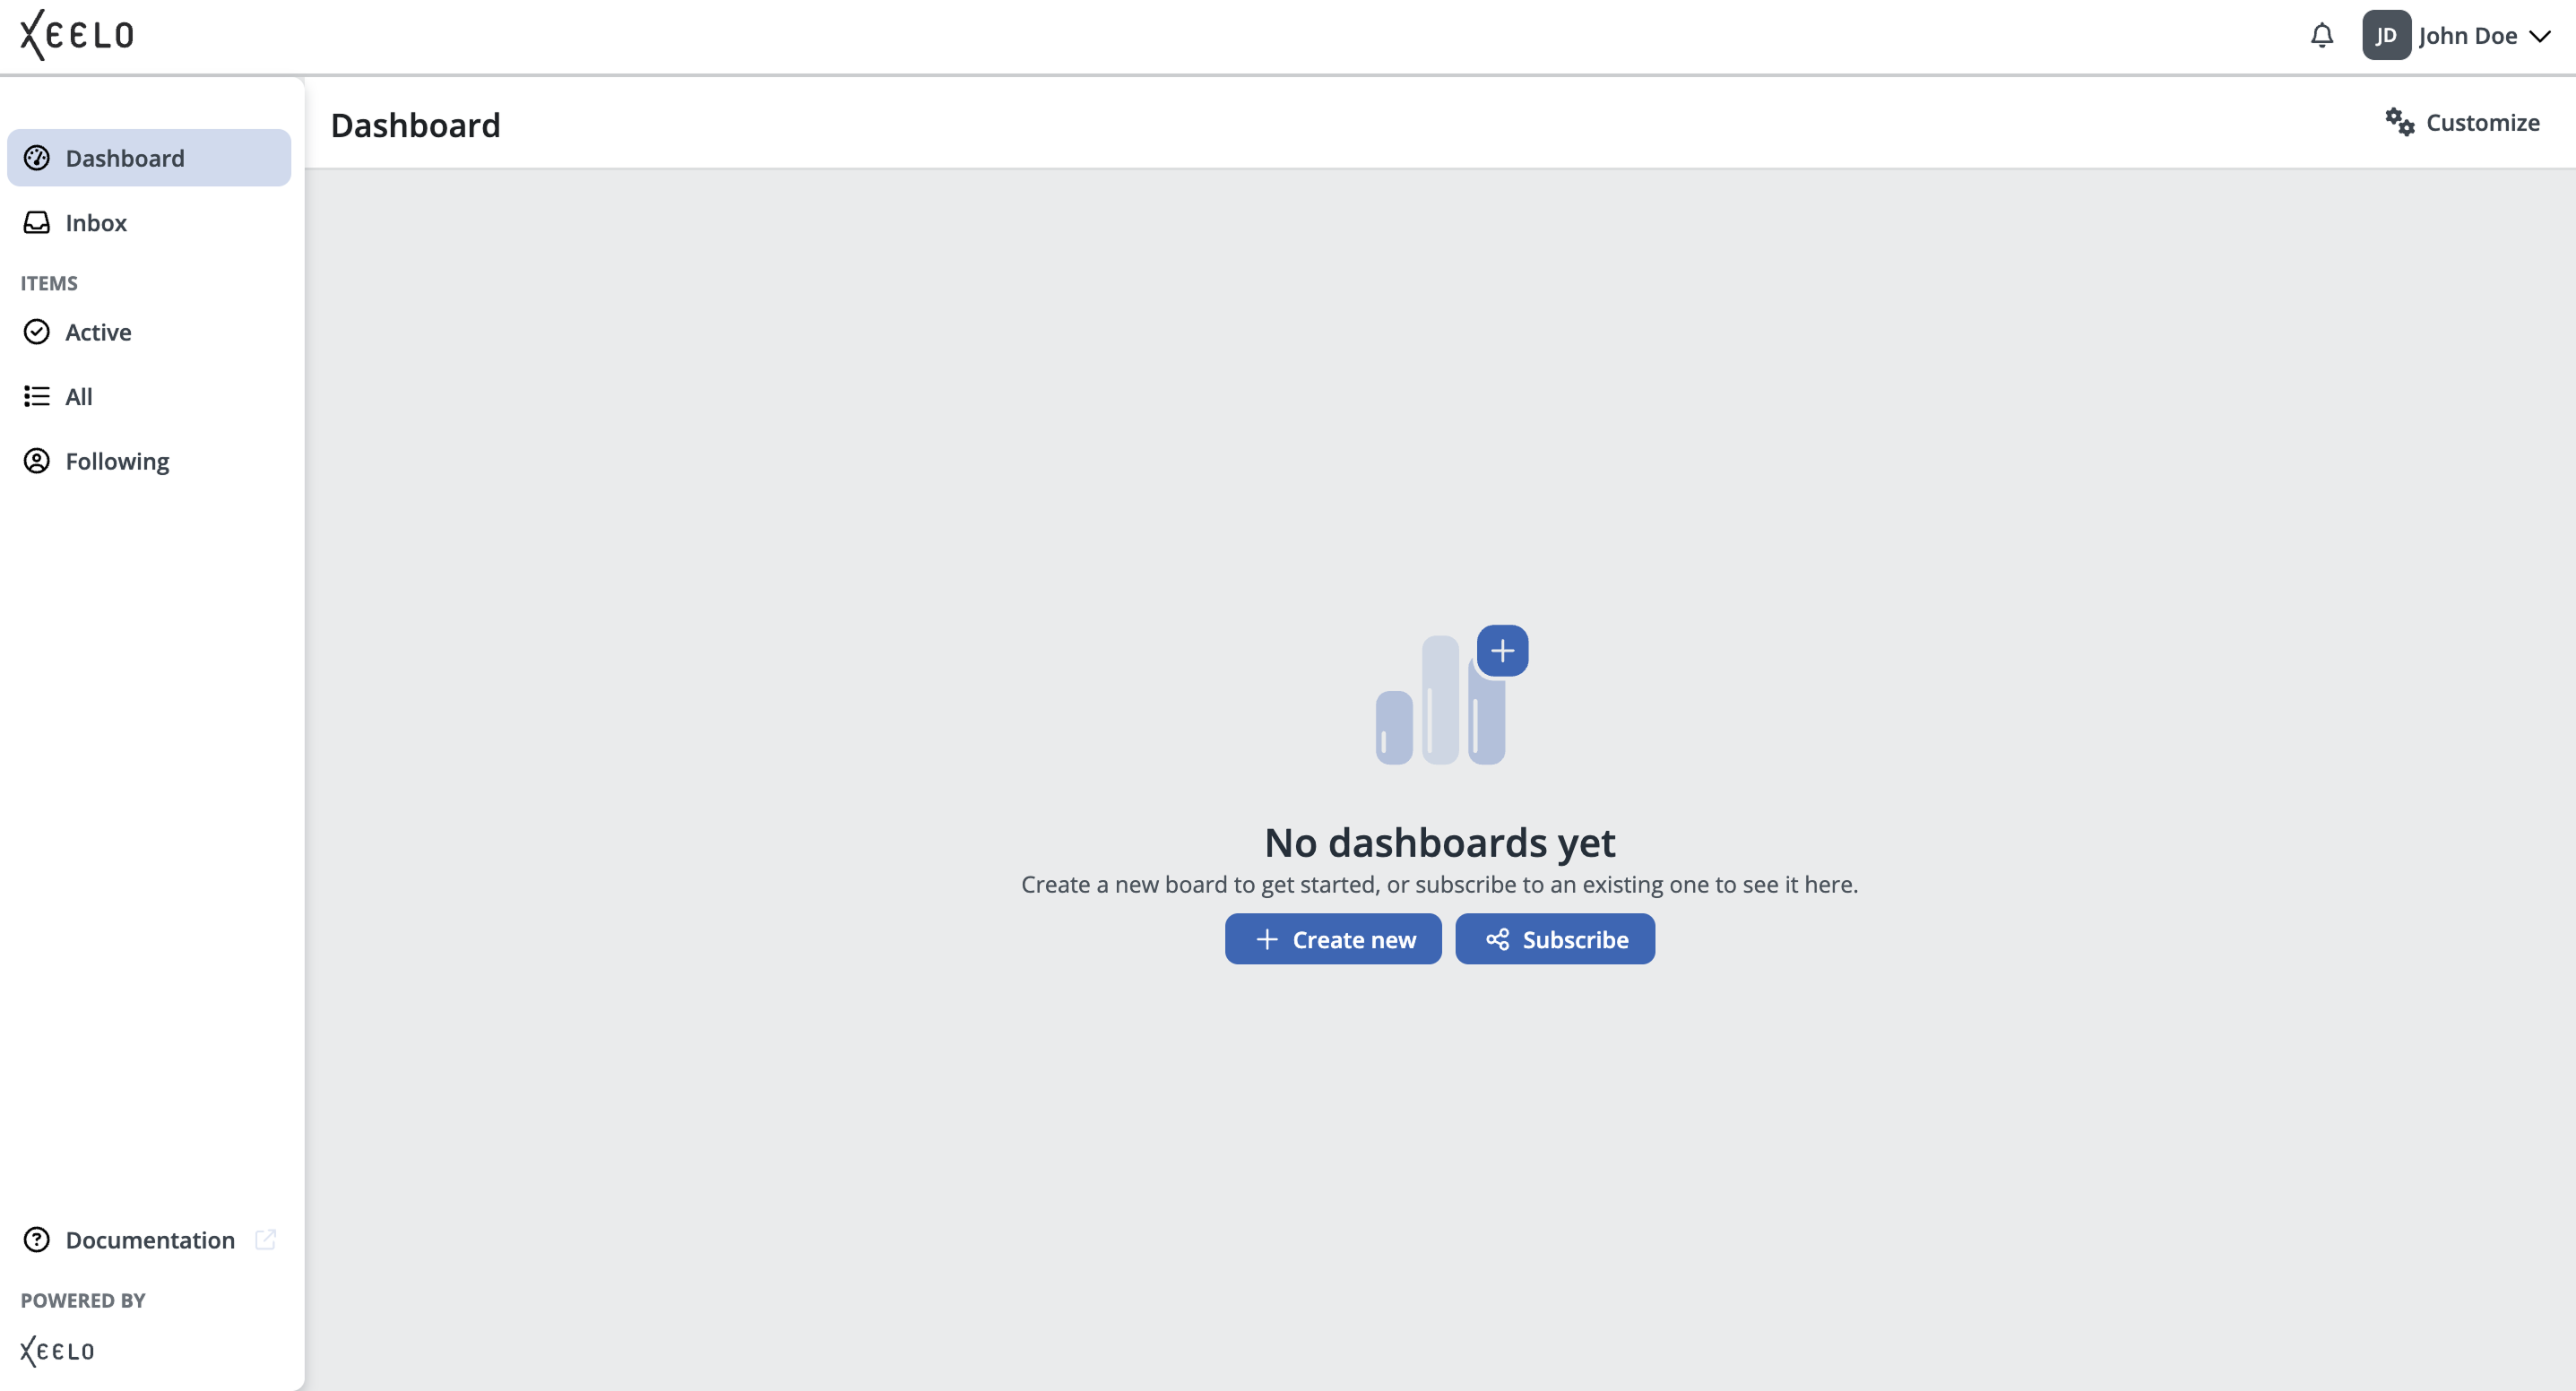
The Create New option creates a new empty dashboard. A panel opens on the right side of the screen where you configure the basic dashboard properties before adding widgets.
In the panel, you can configure:
-
dashboard name
-
whether the dashboard should be shared with other users
-
the widget layout and display behavior
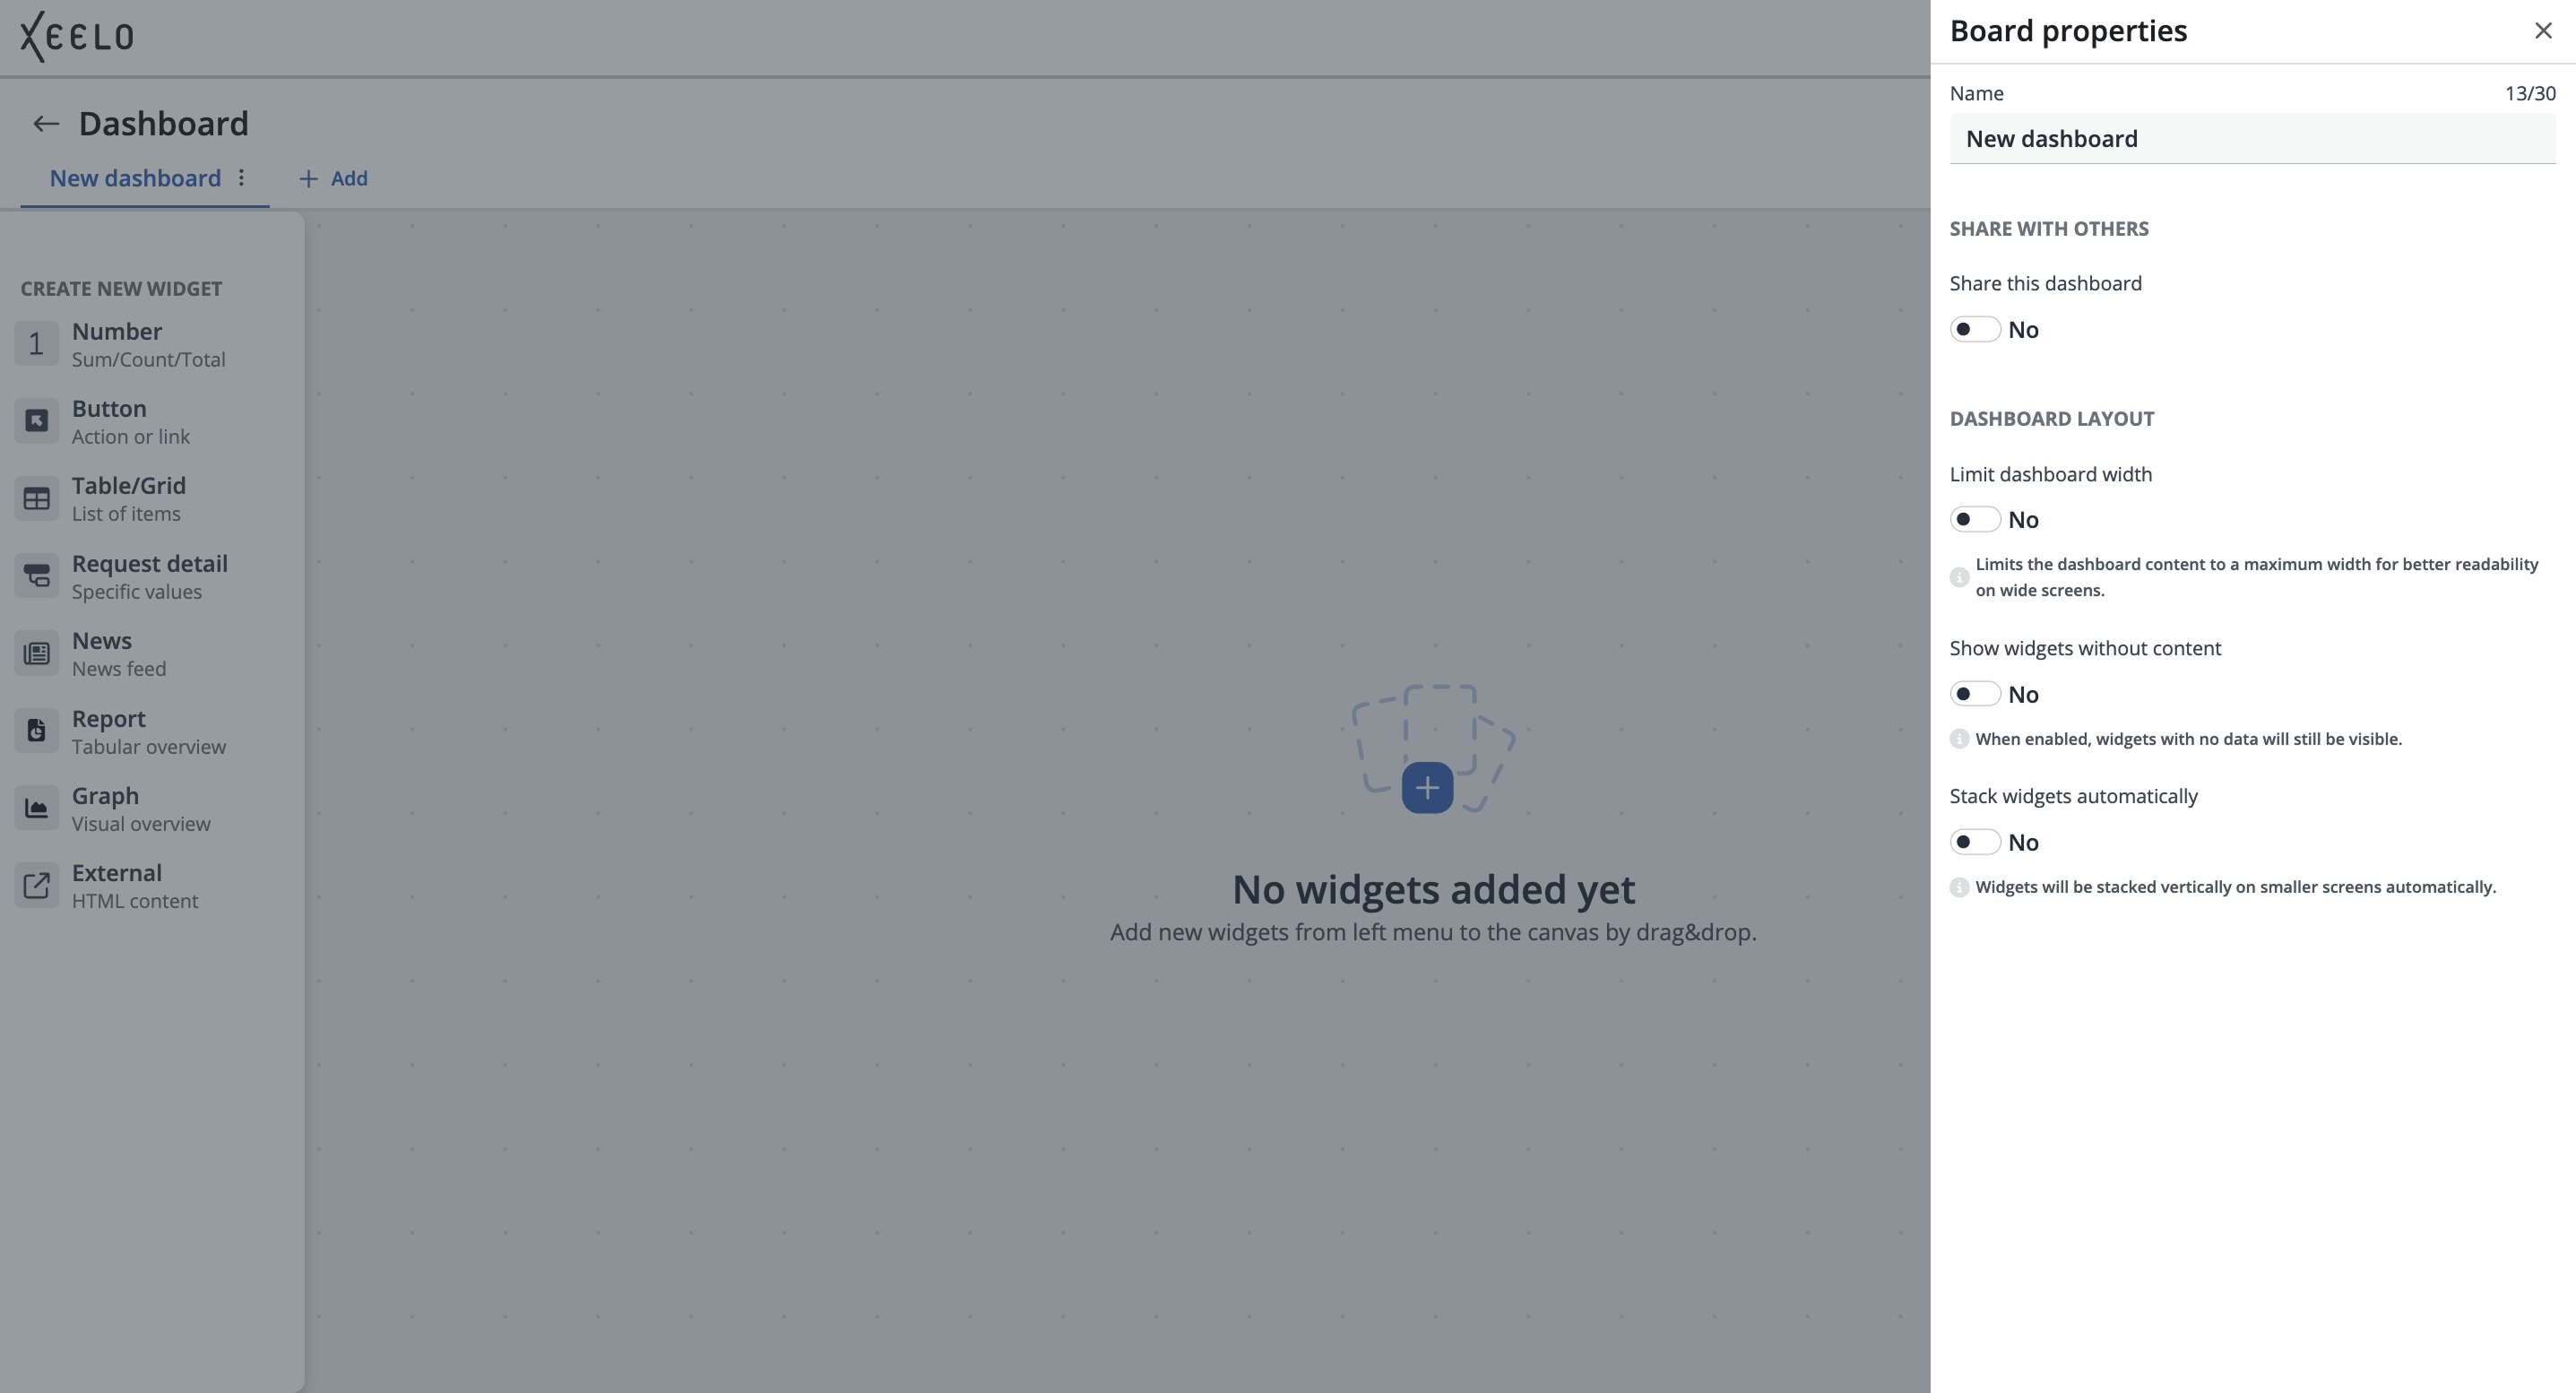
The settings also include options that affect dashboard behavior on different screen sizes. For example, you can limit the maximum dashboard width for better readability on wide monitors, show or hide empty widgets, or enable automatic widget stacking on smaller devices. These settings allow you to customize the dashboard to match your team’s workflow and the type of displayed data.
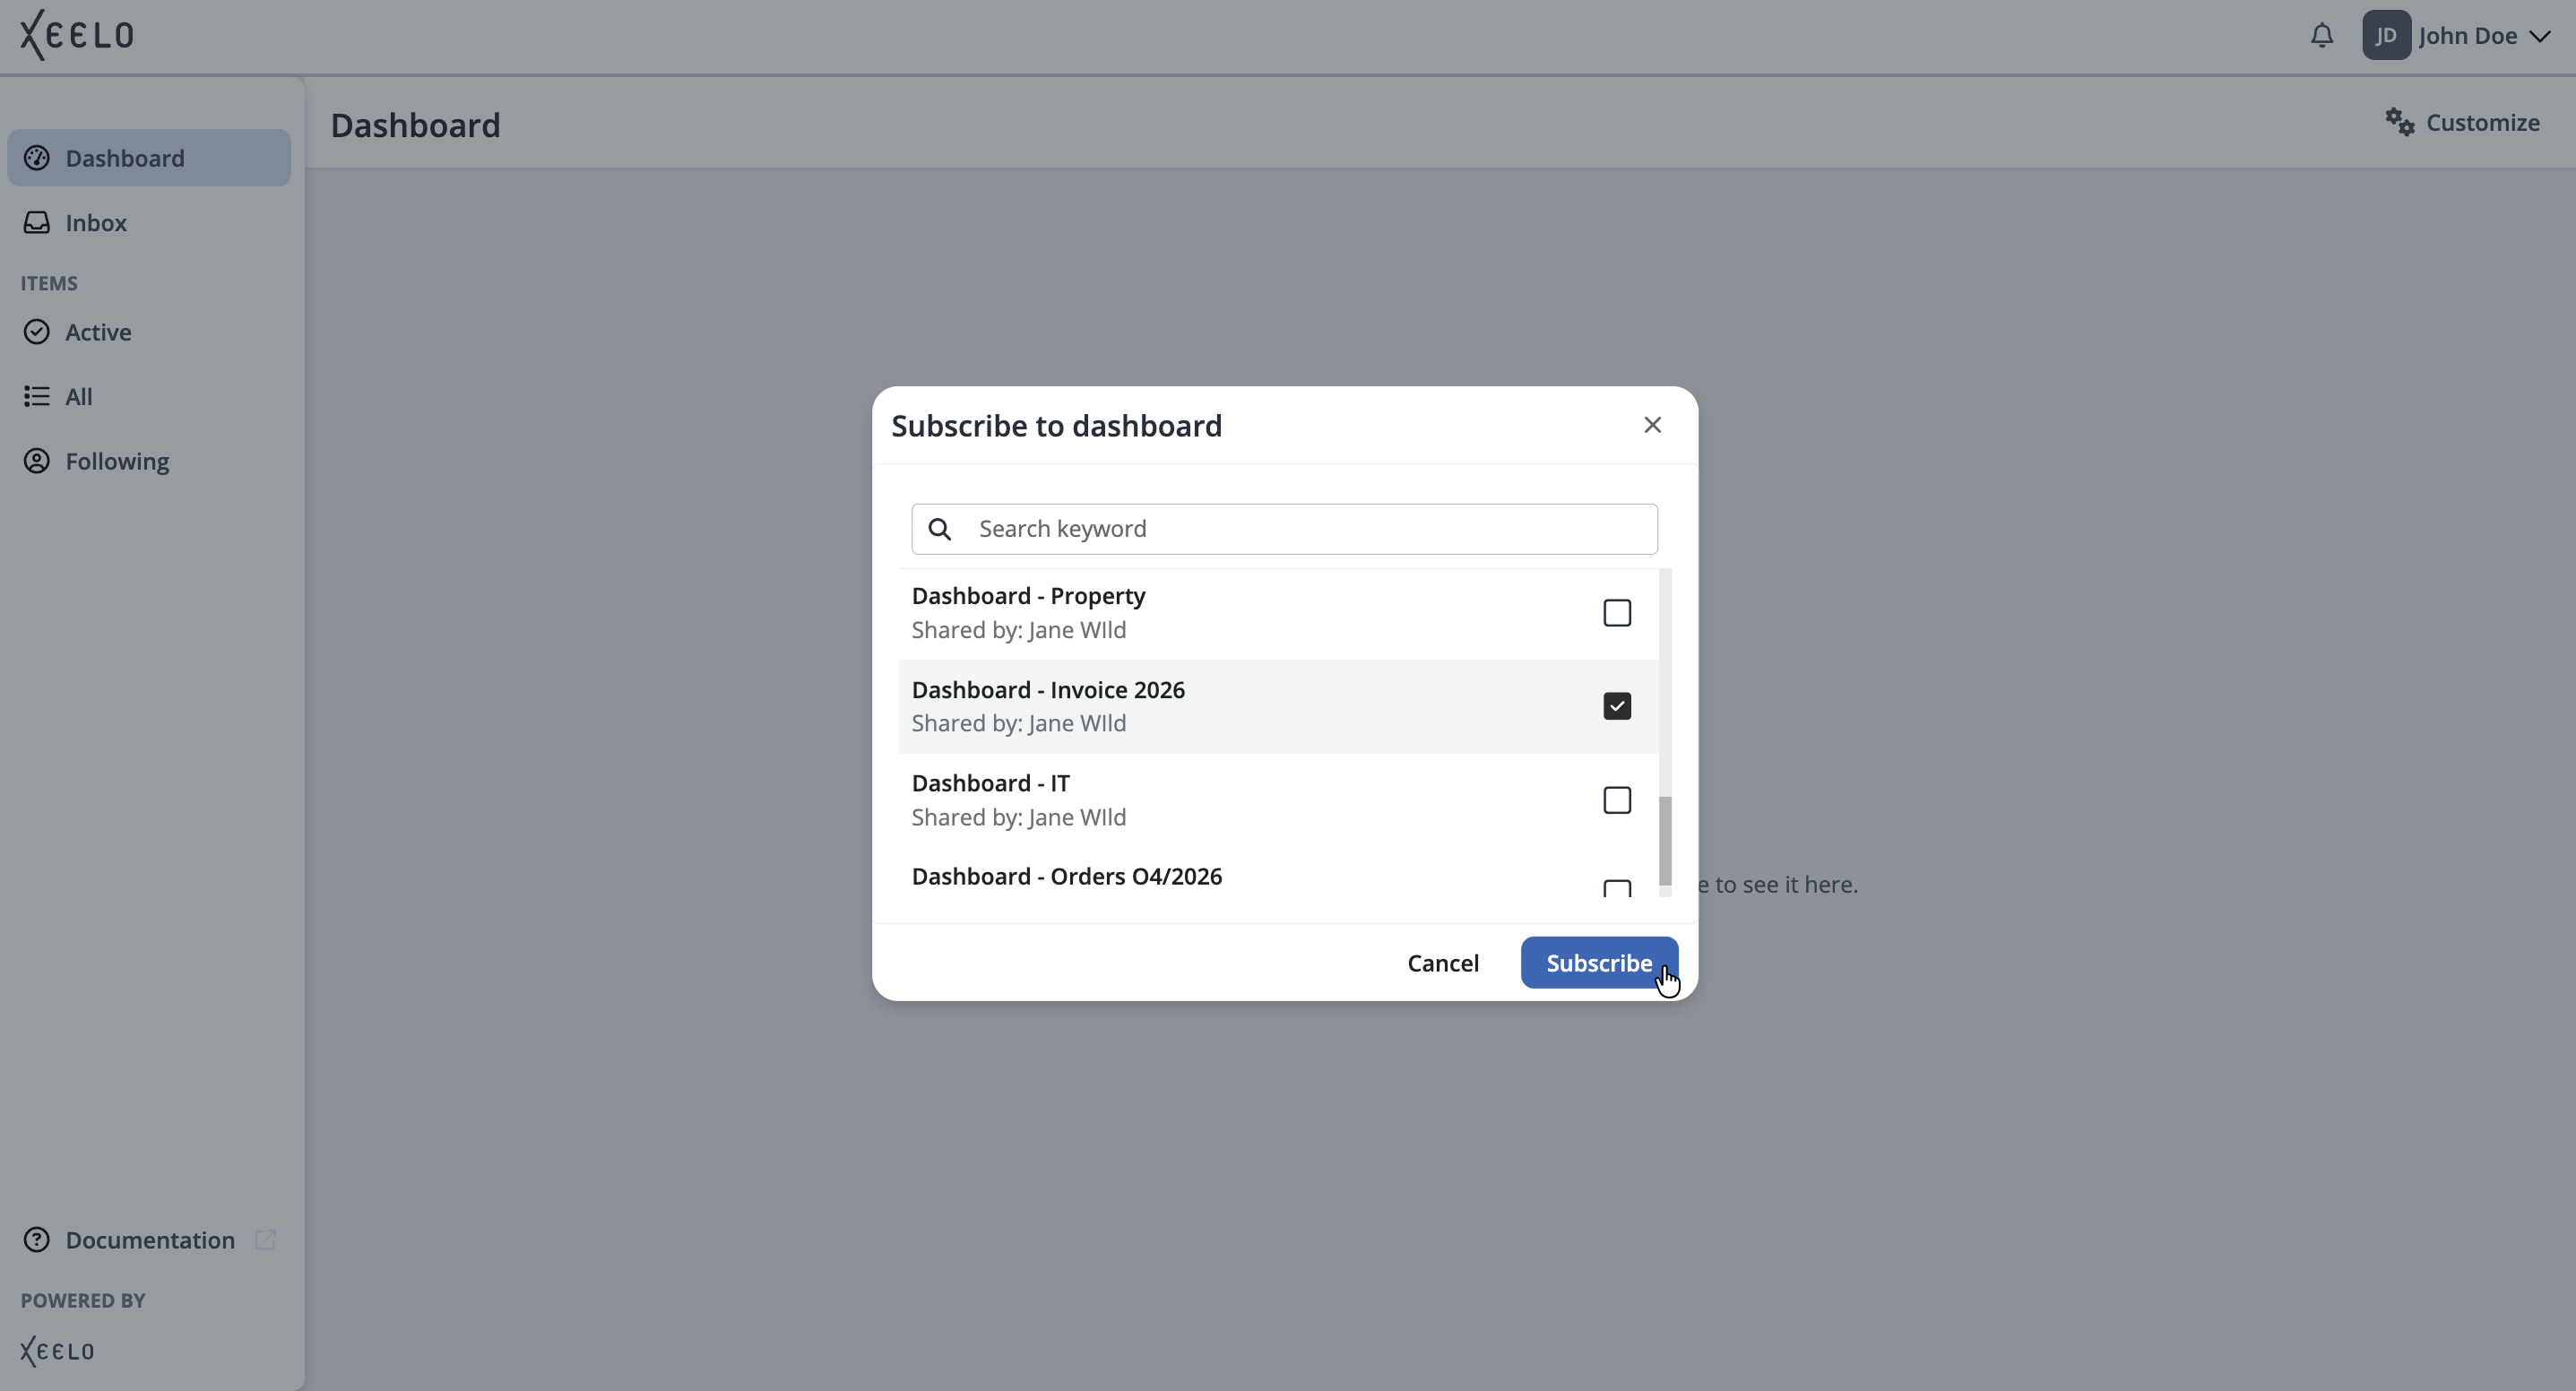
The Subscribe option displays a list of dashboards shared by other users. You can subscribe to a selected dashboard and use it in your environment without creating your own. This option is useful when a team leader or another user has prepared a shared overview for multiple users.
Note
A dashboard you are subscribed to cannot be edited. However, you can create a copy of it. In that case, a new tab is created with full editing capabilities.
Dashboard management
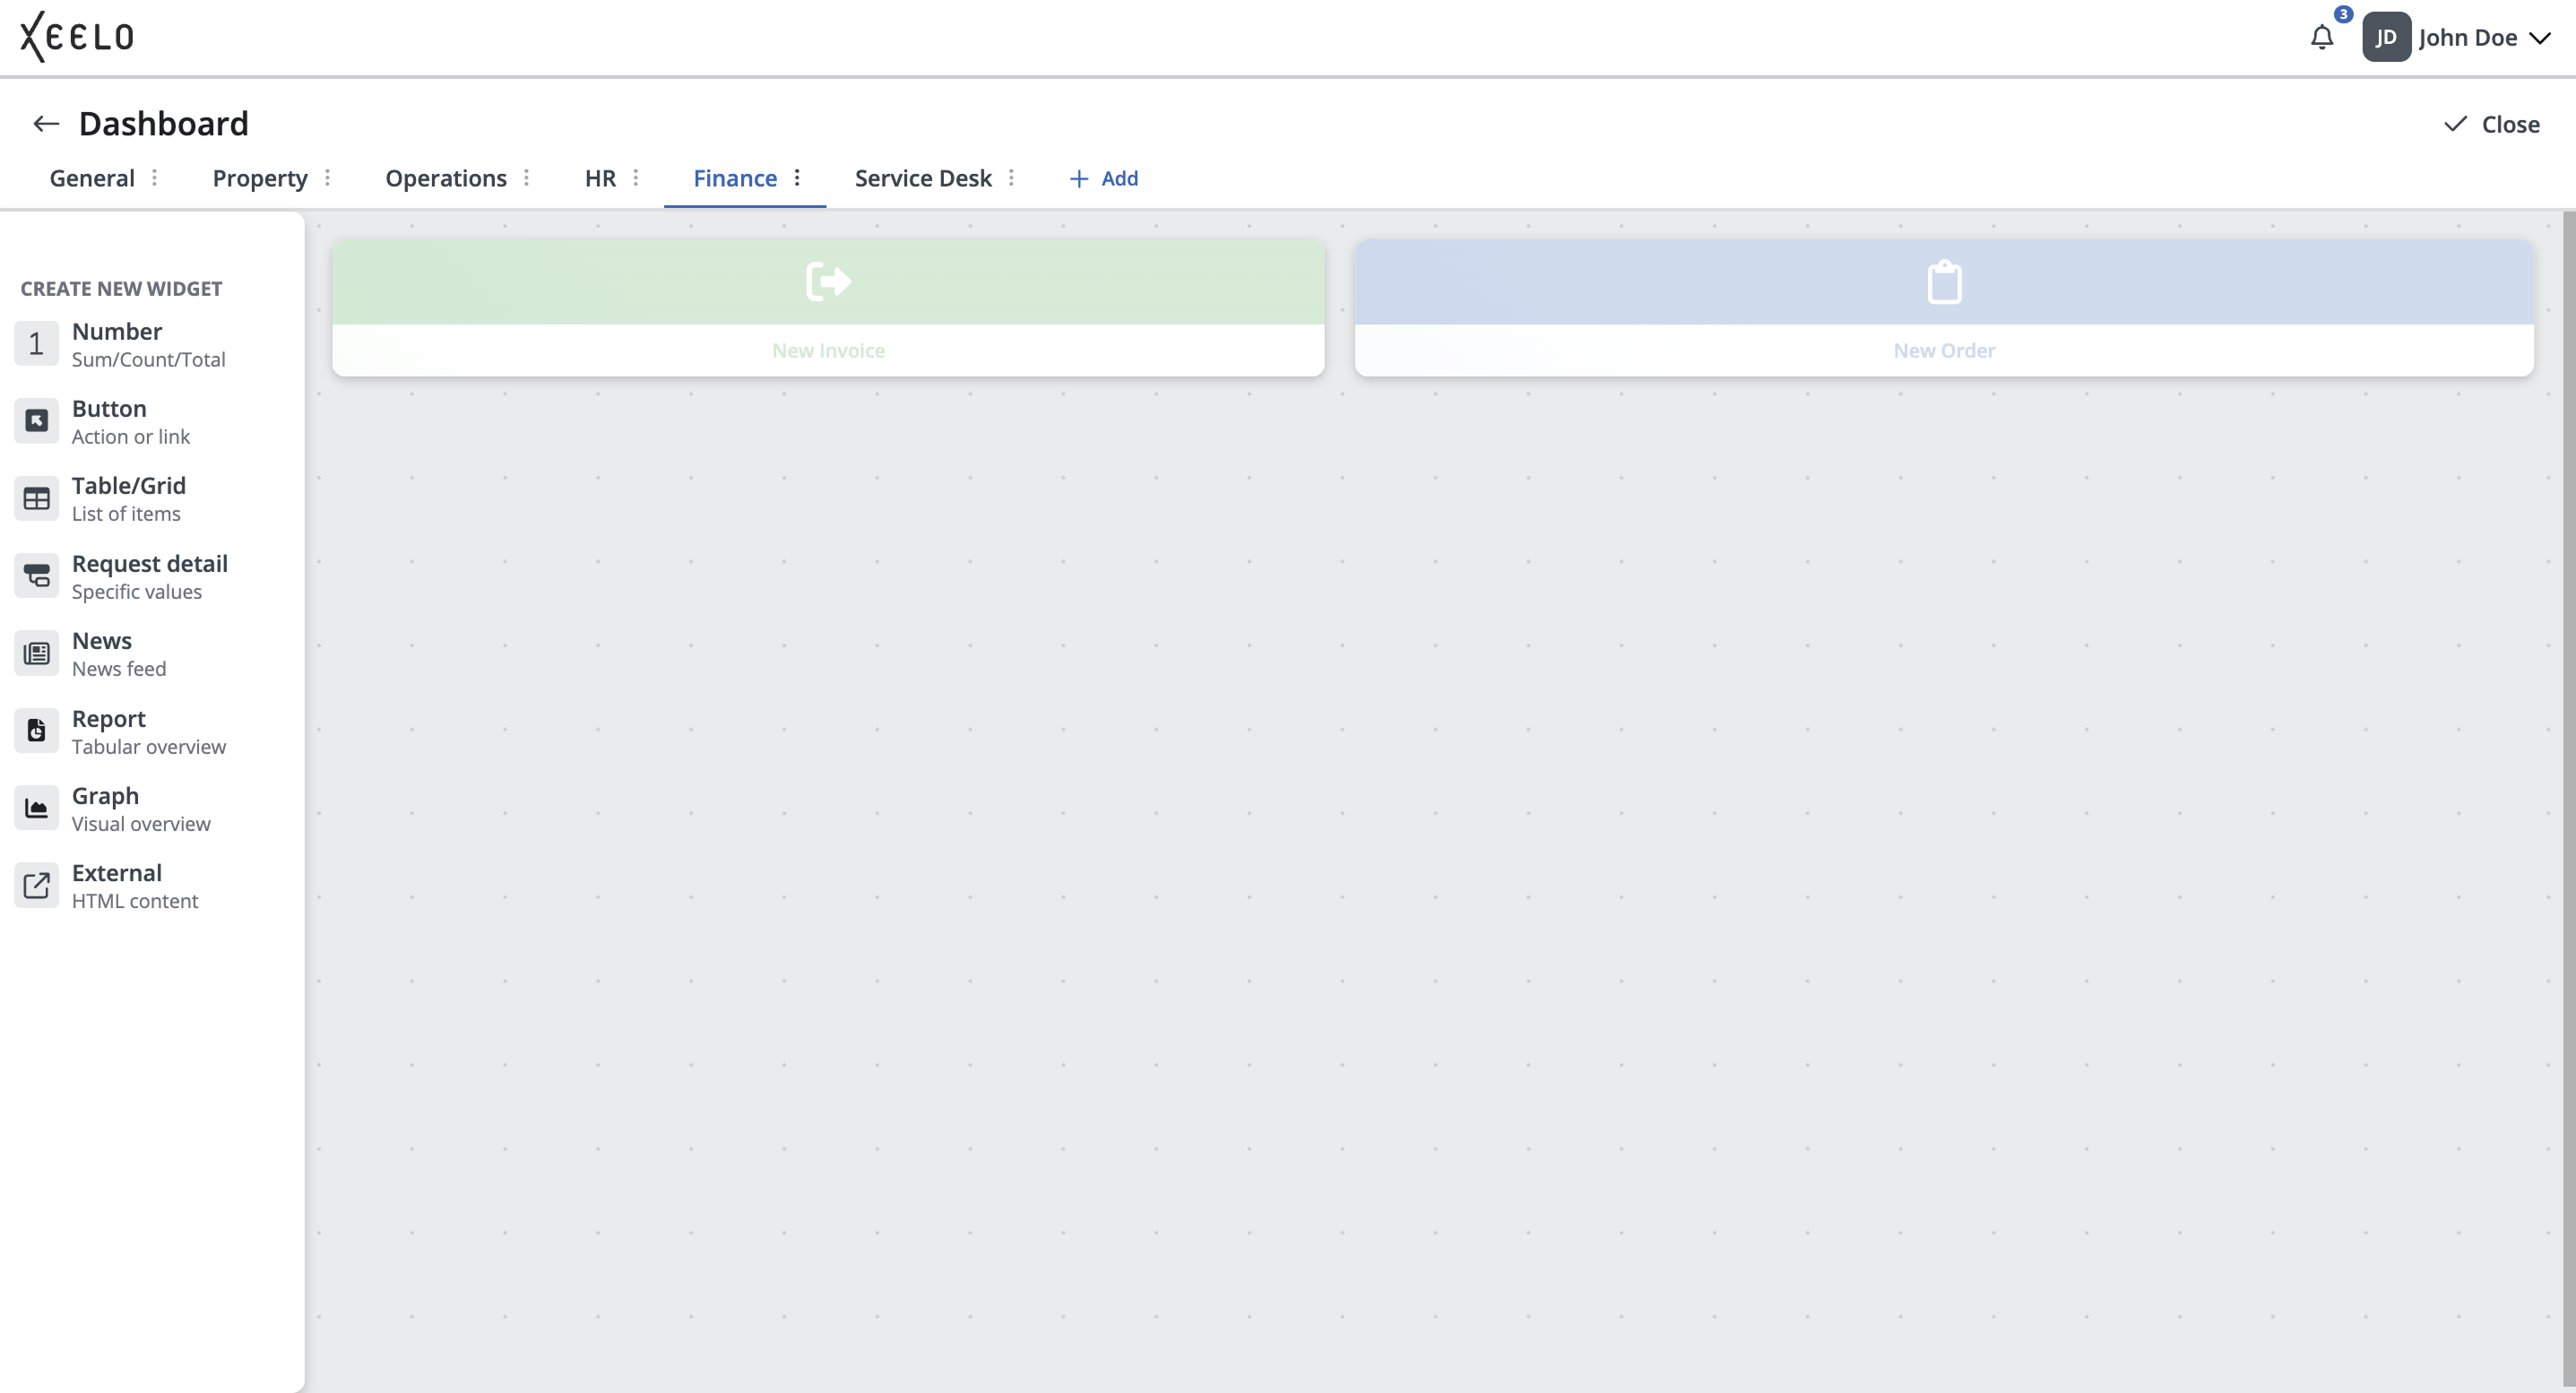
To manage dashboards, click the Customize button in the upper-right corner of the screen. This activates edit mode, where you can modify dashboard content, add new widgets, or change dashboard settings.
If you use multiple dashboards, simply switch to the appropriate tab in the top bar and select the dashboard you want to edit.
After edit mode is activated, a list of available widgets is displayed on the left side of the screen. You can add widgets to the dashboard by dragging them into the workspace. This allows you to gradually build the dashboard exactly according to your team’s needs or the type of displayed data.
The available dashboard management options depend on whether you are the dashboard owner or only subscribed to it.
Managing your own dashboard
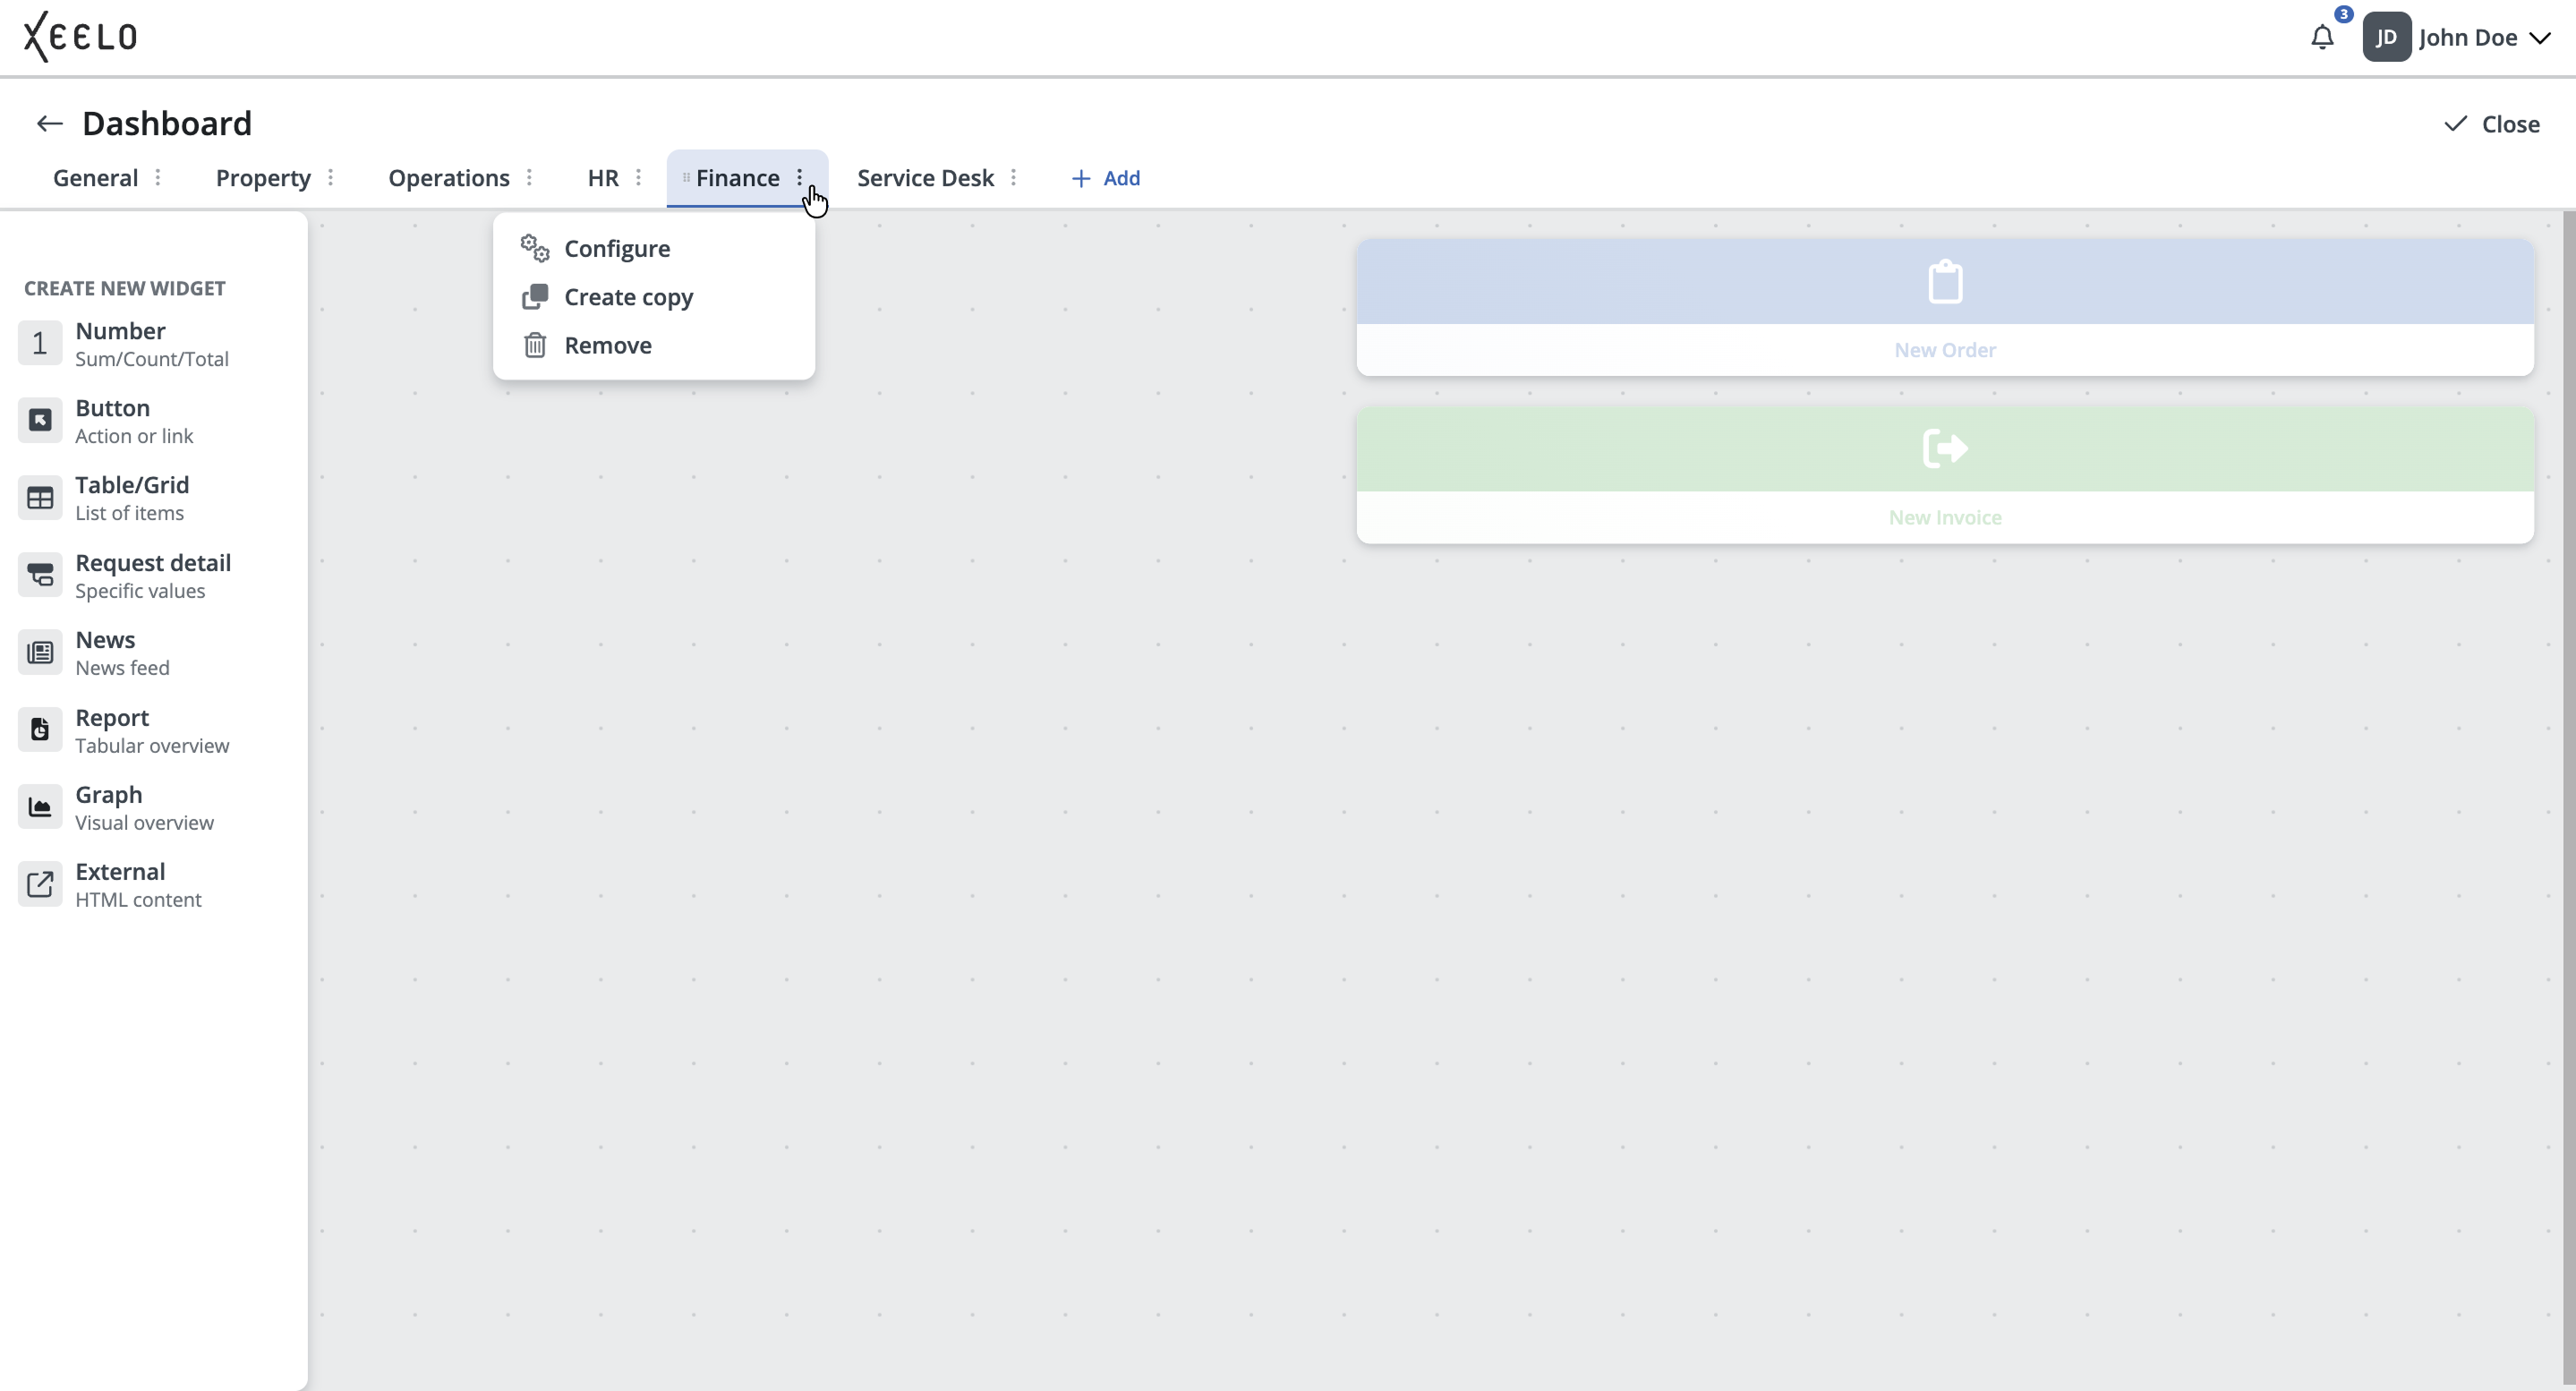
If you are the dashboard author, clicking the three-dot button next to the dashboard name displays the following options:
-
Configure: Opens the Dashboard Properties panel, where you can modify the basic dashboard settings. Available options include changing the dashboard name, sharing settings, and widget layout or behavior configuration.
-
Create copy: Creates a copy of the current dashboard, including all widgets and their settings. This option is useful when you want to preserve the original dashboard while creating a modified version for another team, project, or workflow.
-
Remove: Permanently removes the dashboard, including its configuration and widgets. Deleted dashboards cannot be restored.
Managing a subscribed dashboard
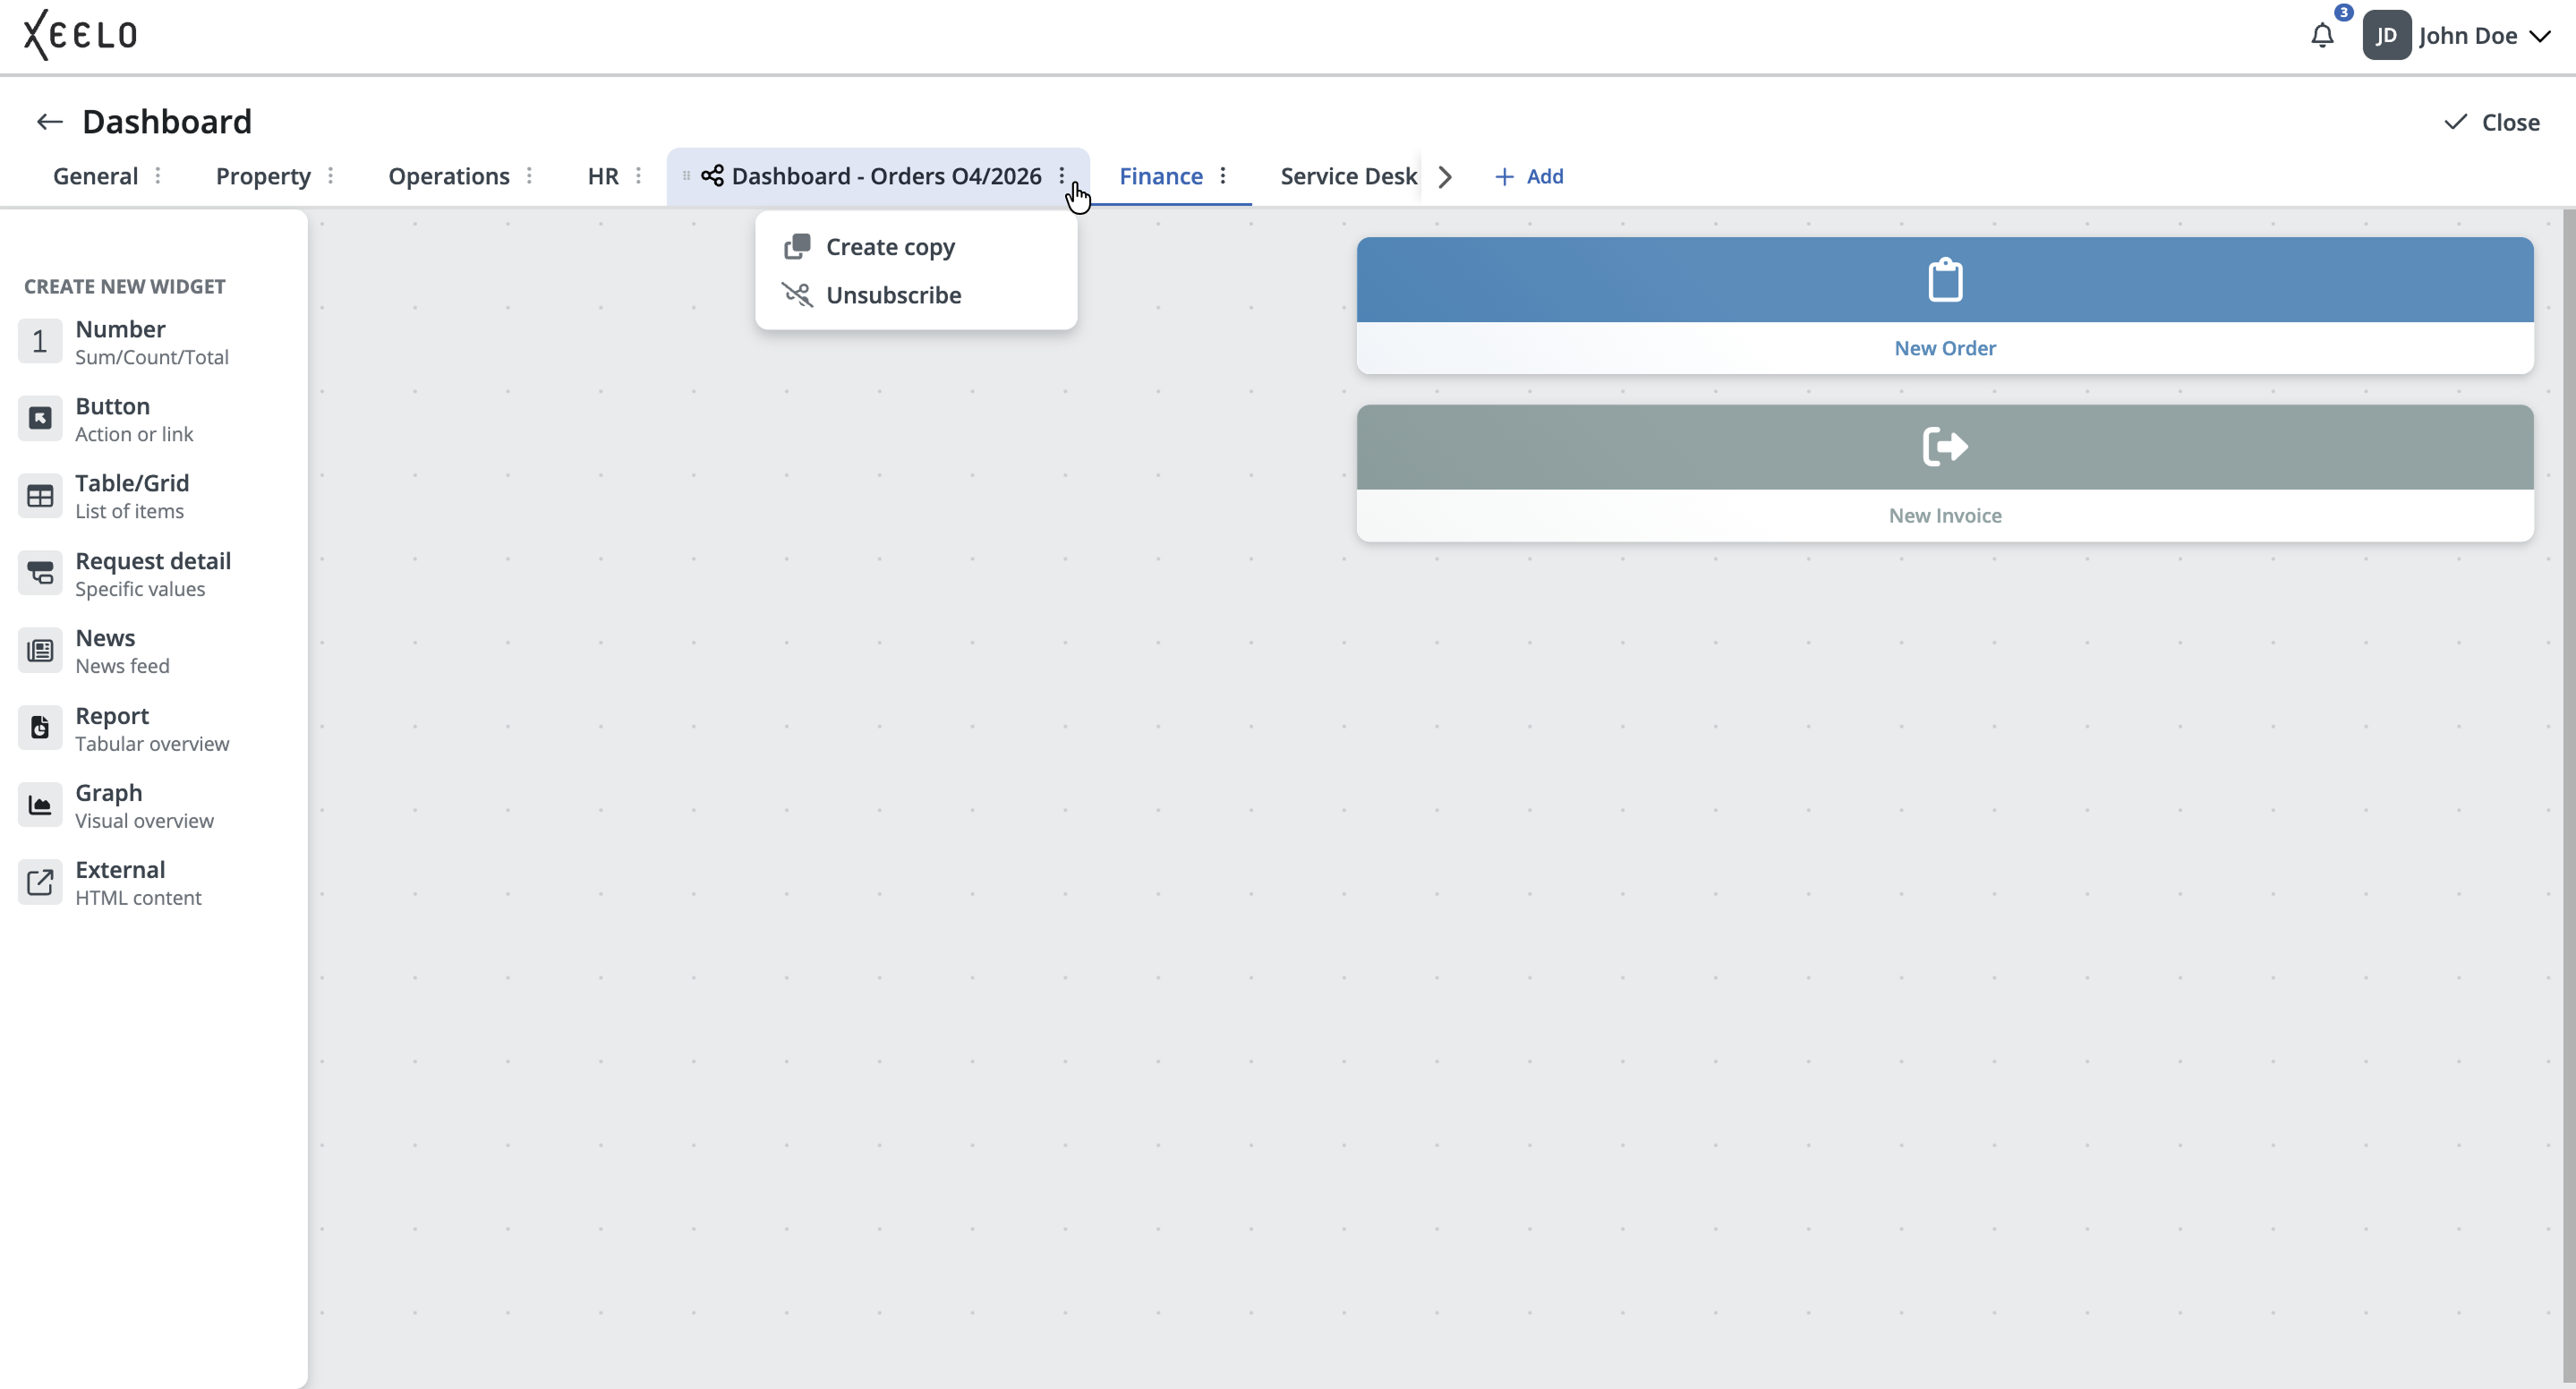
If you are using a dashboard shared by another user, only a limited set of actions is available. Clicking the three-dot button displays the following options:
-
Create Copy: Creates your own copy of the shared dashboard. From that point, you can work with the copy independently and make any changes without affecting the original dashboard.
-
Unsubscribe: Removes the dashboard from your list of dashboards. This action does not delete the original dashboard or affect other users who use it.
Changing dashboard order
You can change the order of dashboards in the top bar at any time. In edit mode, simply drag the left side of the dashboard tab to the desired position. This allows you to organize dashboards by priority, workflow type, or frequency of use.
Automatic saving of changes
All changes made to the dashboard (adding, editing, or removing widgets) are saved automatically.
After you finish editing, click the Close button. This closes edit mode and switches the dashboard back to widget view.
Widgets
Widgets are the building blocks of the dashboard. Each widget displays a specific type of information or provides a specific action. Widgets allow you to customize the dashboard according to your needs — whether you want to monitor key metrics, access quick links to requests, or work with an external application.
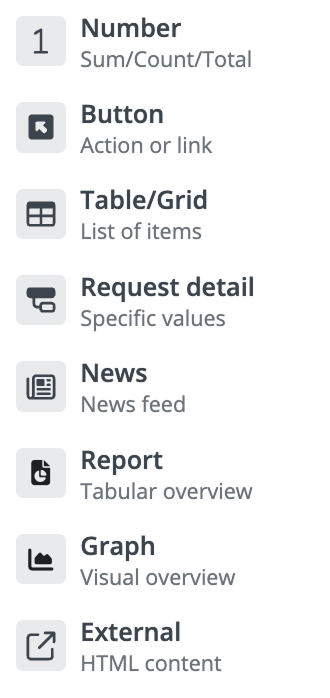
Each widget has its own specific purpose. Below is an overview of all available widget types:
-
Number – Displays the number of items or the sum of values based on the selected configuration.
-
Button – Create a new request with a single click.
-
Table/Grid – Displays a list of requests based on the selected filter.
-
Request detail – Allows you to pin a specific request detail to the dashboard for quick access.
-
News – Displays internal announcements, news, or notifications.
-
Report – Displays the output of a preconfigured report, including filtered data and generated summaries.
-
Graph – Visualizes data in a graph format, such as value trends.
-
External – Displays content from an external system or website directly within the dashboard environment.
Adding a widget to the dashboard
To add a widget, use dashboard edit mode and simply drag the widget from the left panel into the dashboard workspace. While placing the widget, a live preview is displayed, allowing you to easily determine its final position among other dashboard elements.
After placing the widget on the dashboard, a configuration panel for the selected widget automatically opens on the right side of the screen. Each widget type provides its own set of configuration options depending on its purpose and usage. Detailed descriptions of individual widget types and their configuration options are available below.
Moving and resizing widgets
You can change the widget position at any time. Simply drag the widget to the desired location within the dashboard.
Resize the widget using its edges or corners. When you hover over the widget, resize controls appear, allowing you to enlarge or reduce the widget size as needed.
Widget types
You can choose from different widget types depending on the content you want to display or the action you want to provide. Each widget type offers its own configuration options and specific use cases — from request overviews to buttons for quickly creating new records.
Number
This widget displays a single aggregated numeric value based on data from the selected object. It allows you to quickly monitor important metrics directly on the dashboard without opening detailed overviews or request lists.
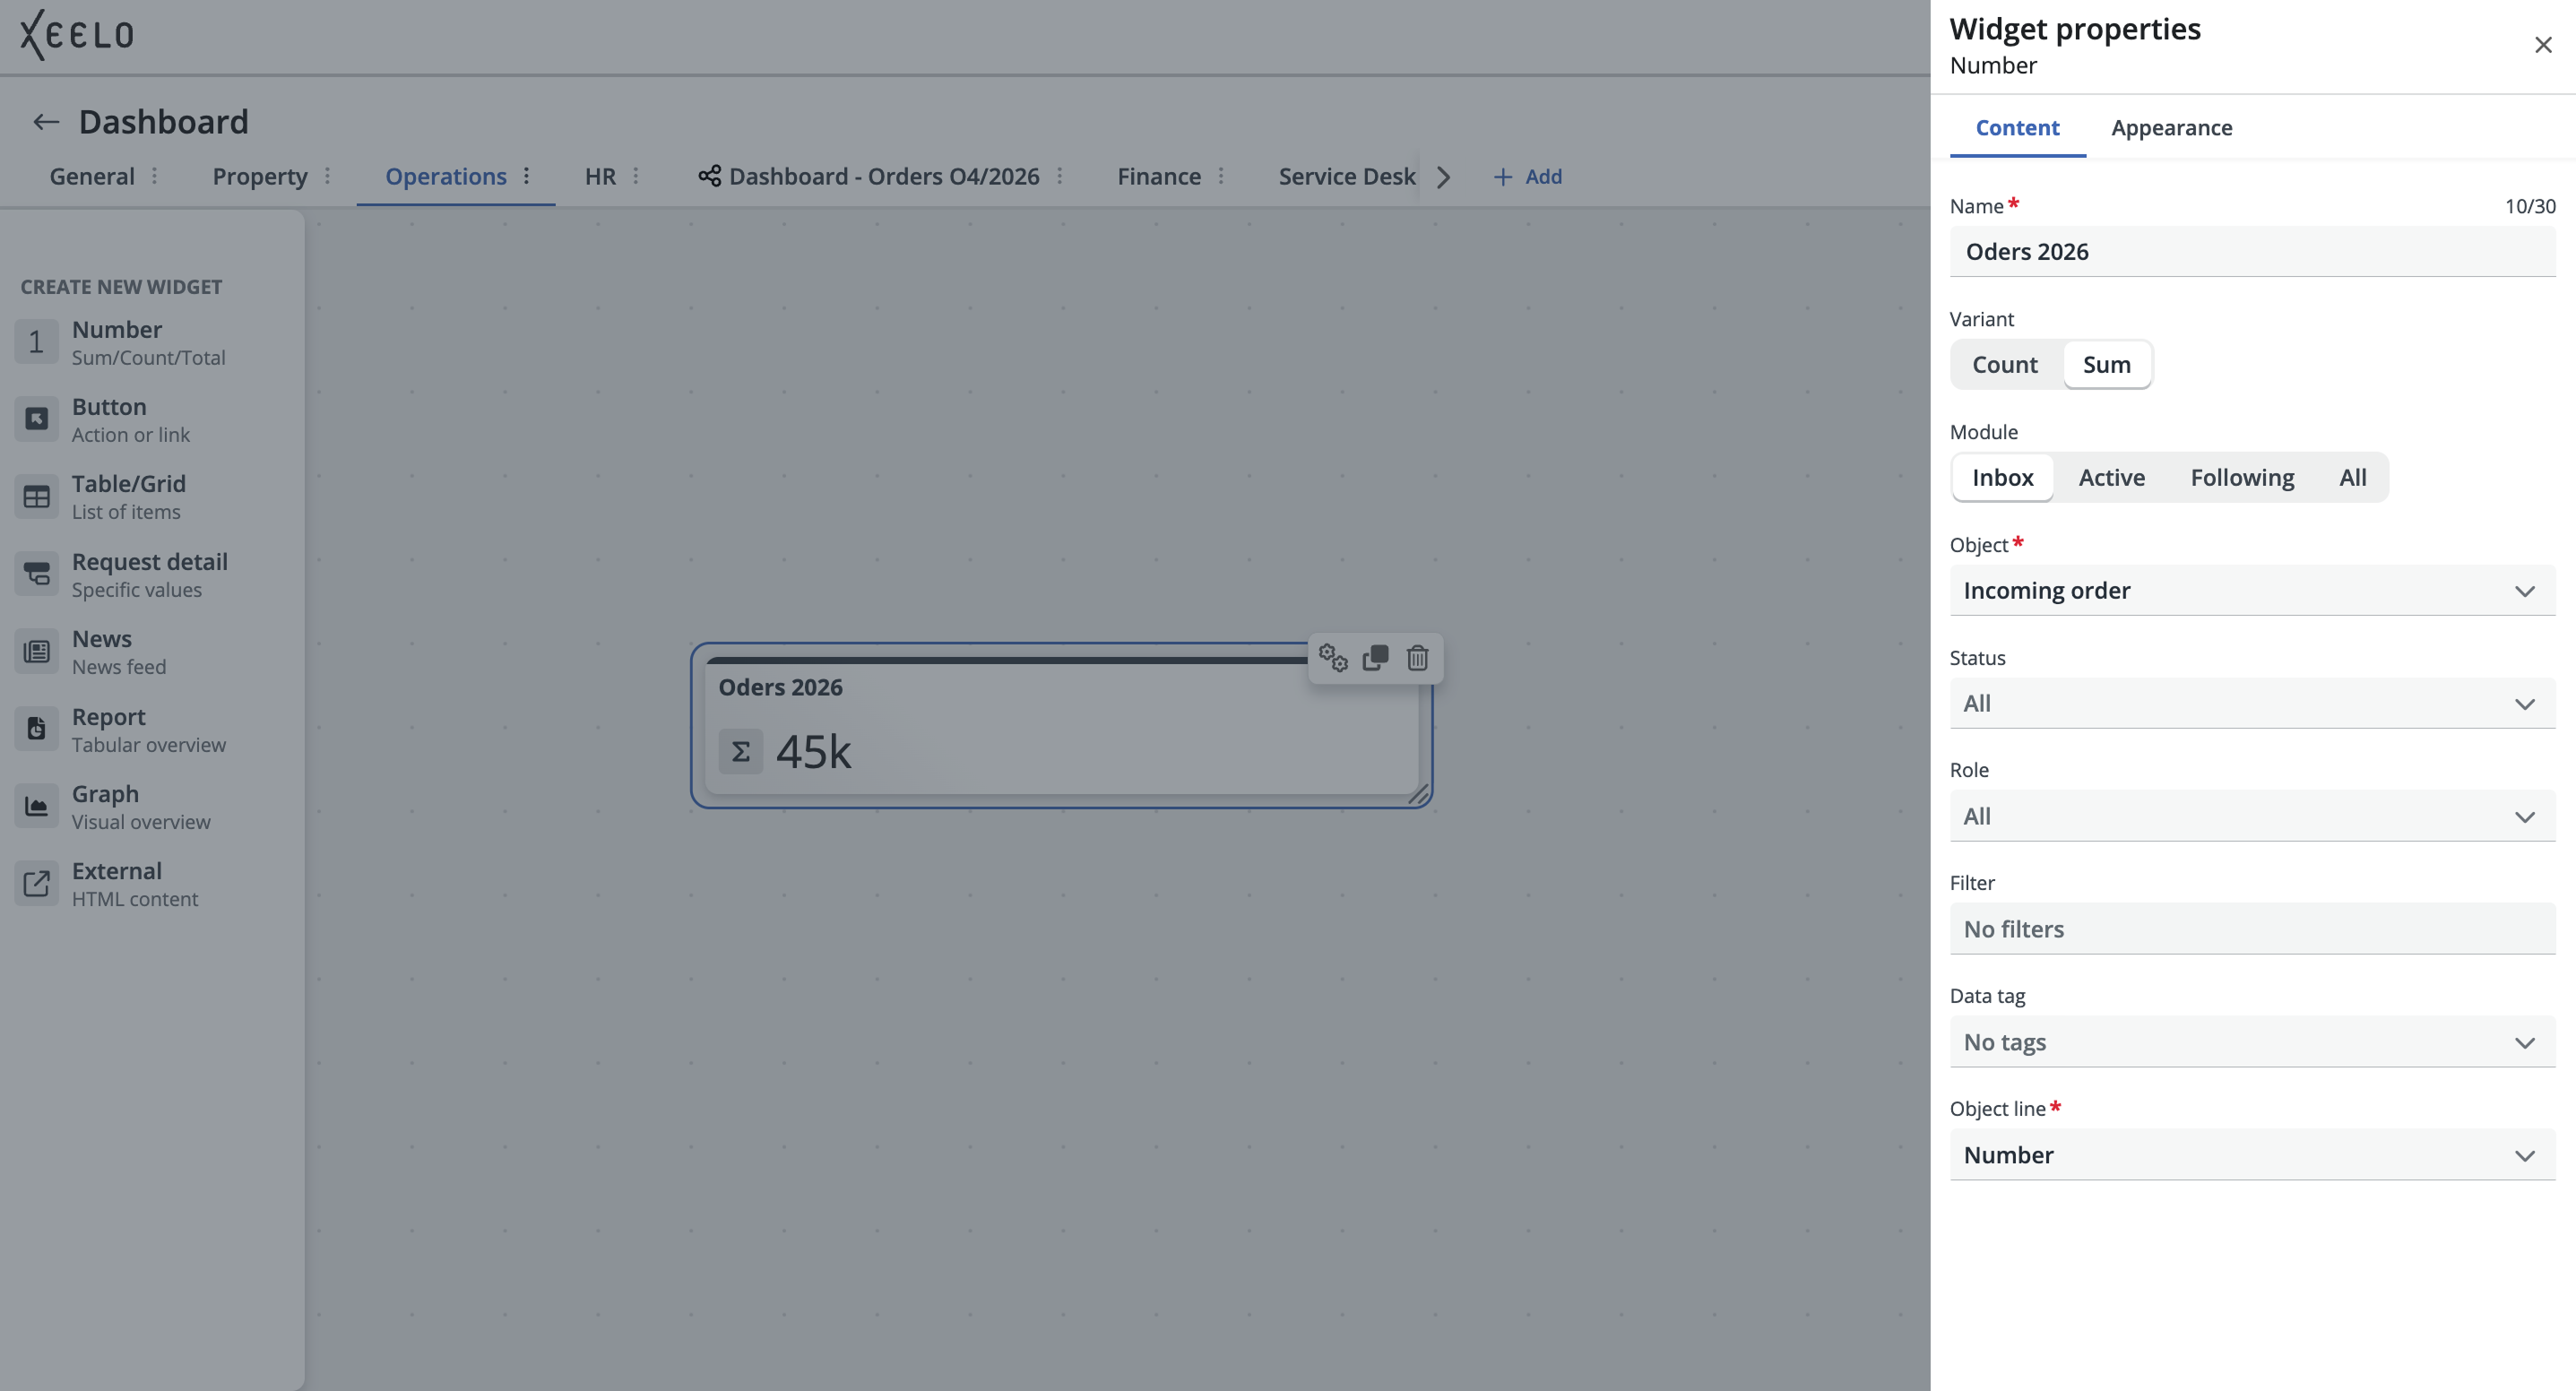
When configuring the widget, first select the type of value you want to display:
- Count – Displays the number of requests matching the specified conditions.
- Sum – Calculates the sum of values from the selected numeric field across matching requests.
Then configure:
-
Module (Inbox, Active, Following, or All)
-
Object from which the data should be loaded.
-
For the Sum option, also select the numeric field whose values should be summed.
You can further refine the result using filters based on role, status, tags, or a saved custom filter.
The displayed value is automatically updated according to the current system data and always reflects the selected conditions and filters.
On the Appearance tab, you can also enable conditional value highlighting. This allows the widget to visually highlight important or non-standard conditions based on defined thresholds.
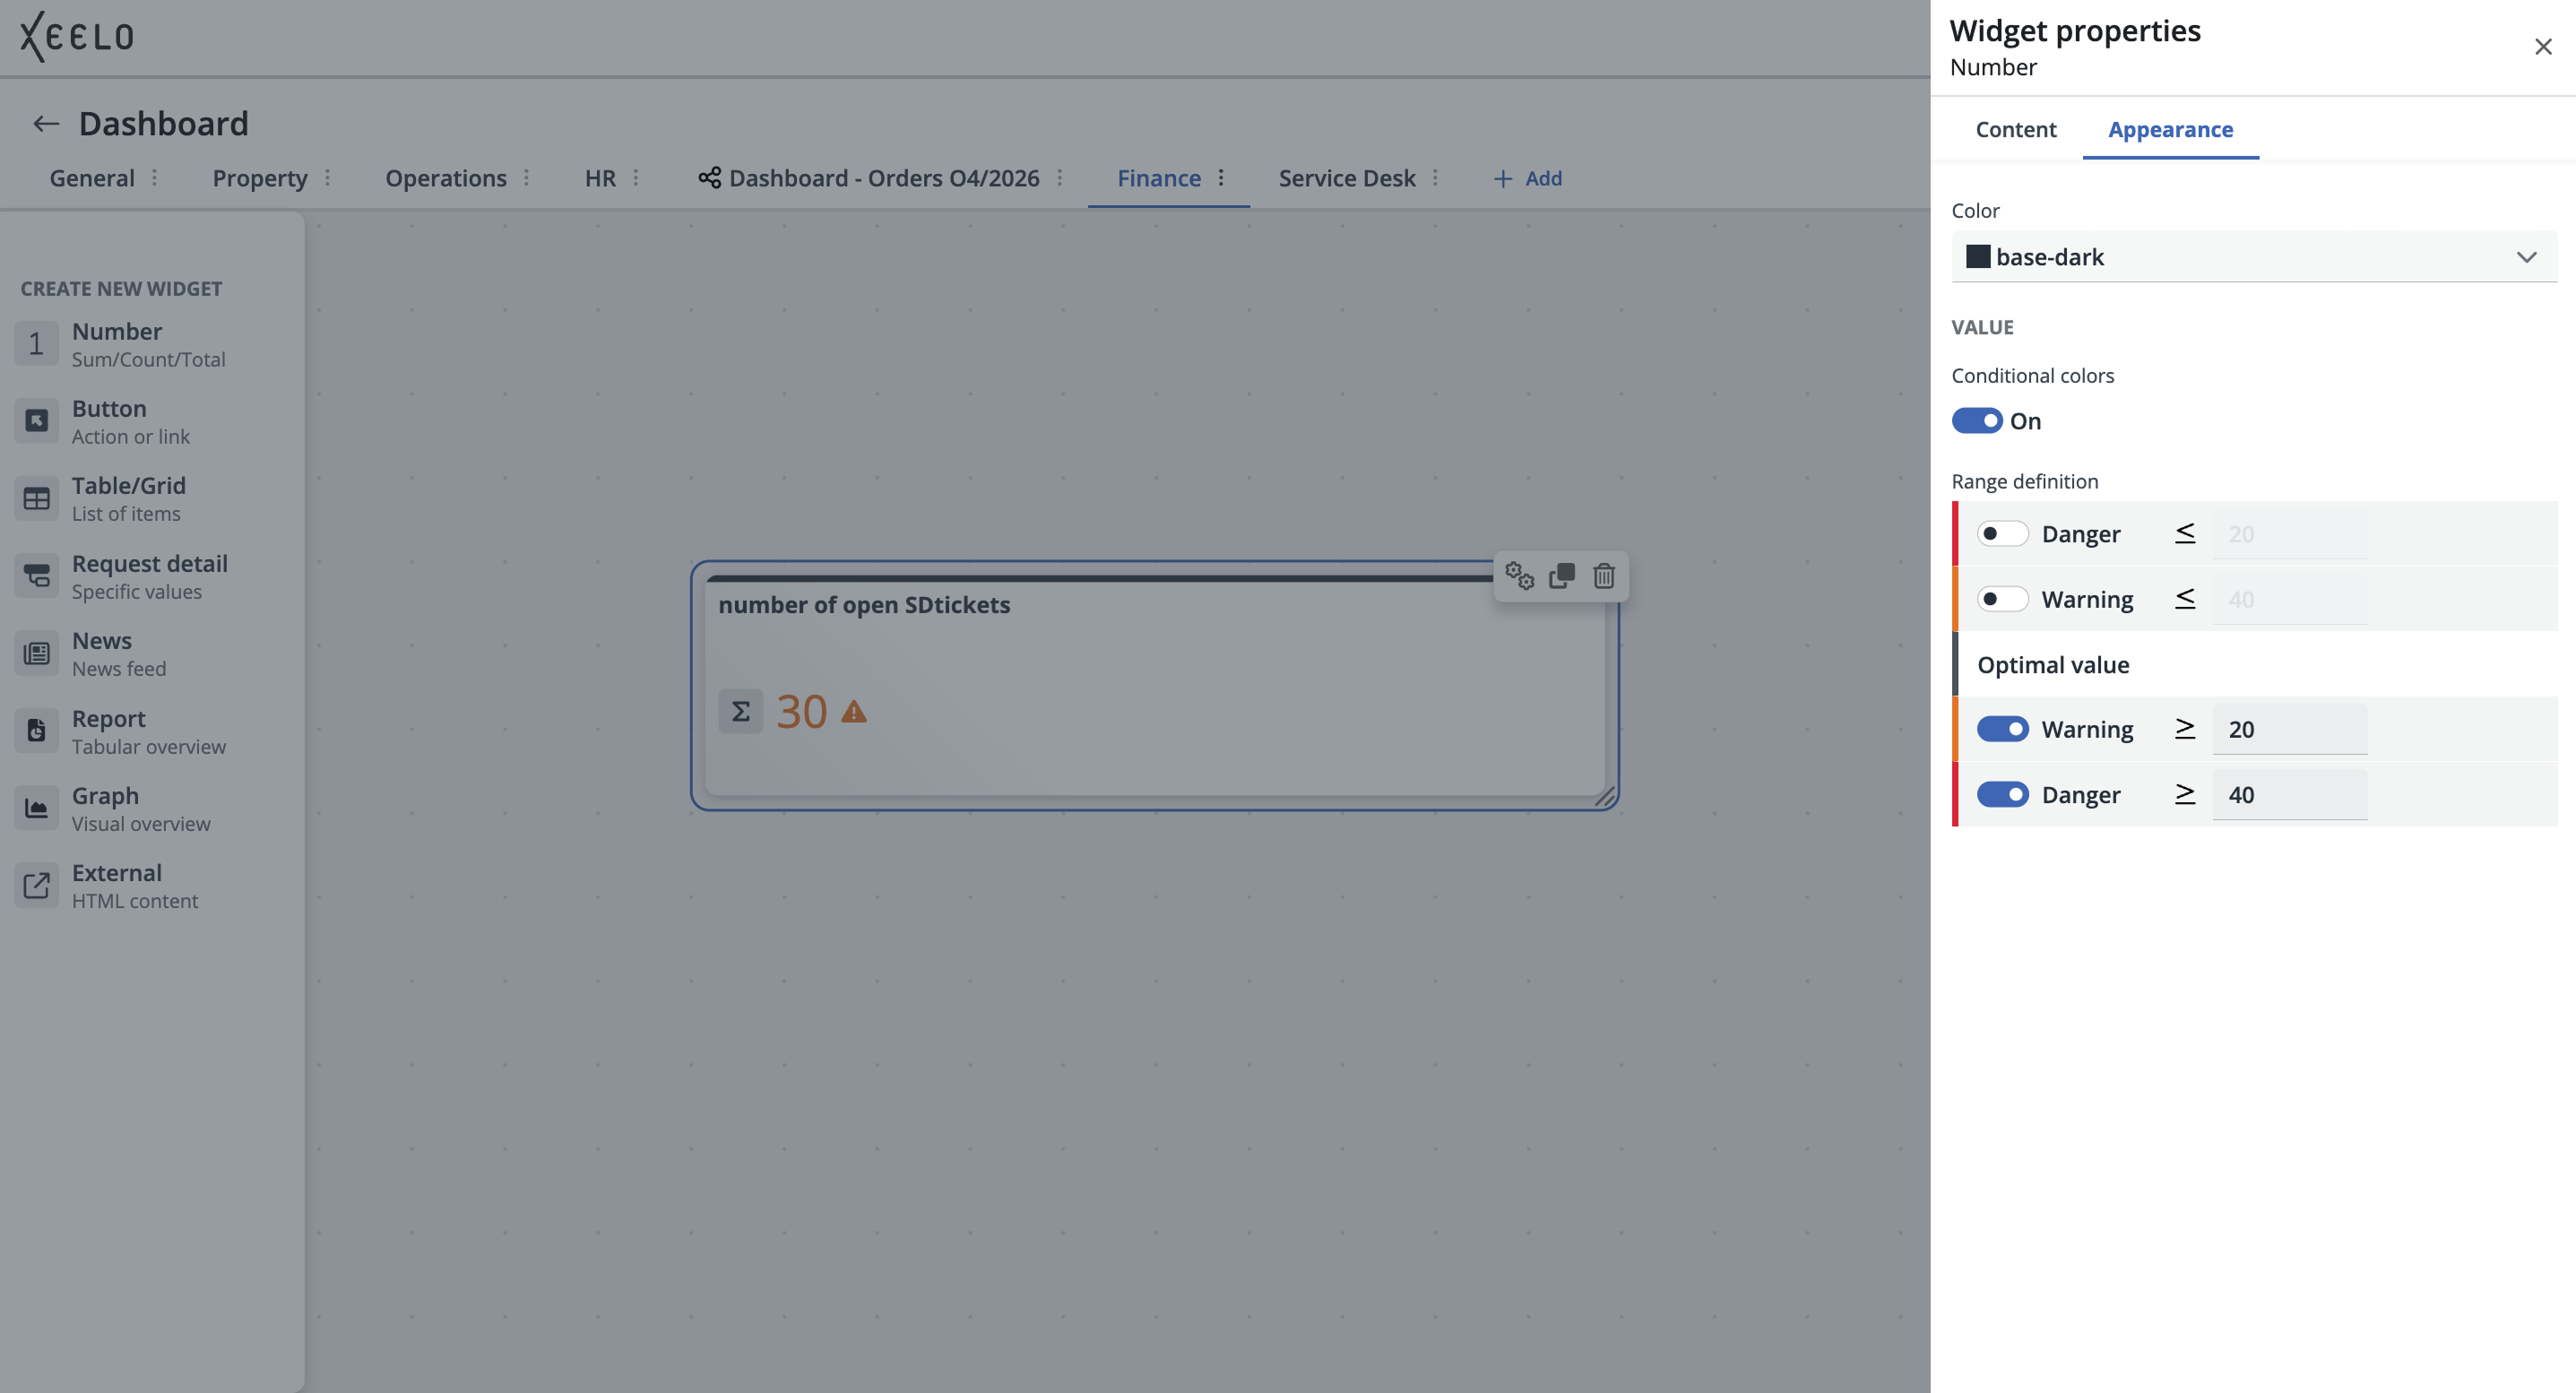
Available levels:
- Optimal Value – standard condition without highlighting
- Warning – values requiring increased attention
- Danger – critical values indicating a problem or exceeded threshold
You can configure custom threshold values for each level. The widget then automatically changes the color highlighting according to the currently displayed result.
This feature is useful, for example, for monitoring the number of unresolved requests, exceeded limits, cost volumes, or other KPIs where quick identification of risky states is important.
Tip
You can use this widget to monitor the number of open requests, high-priority tasks, or the total value of issued invoices for a selected period. This provides an immediate overview of important information directly on the dashboard.
Button
This widget serves as a quick shortcut for creating new requests. It allows you to start a new task directly from the dashboard in a specific object — for example, create a new invoice, submit a vacation request, or request a business trip.
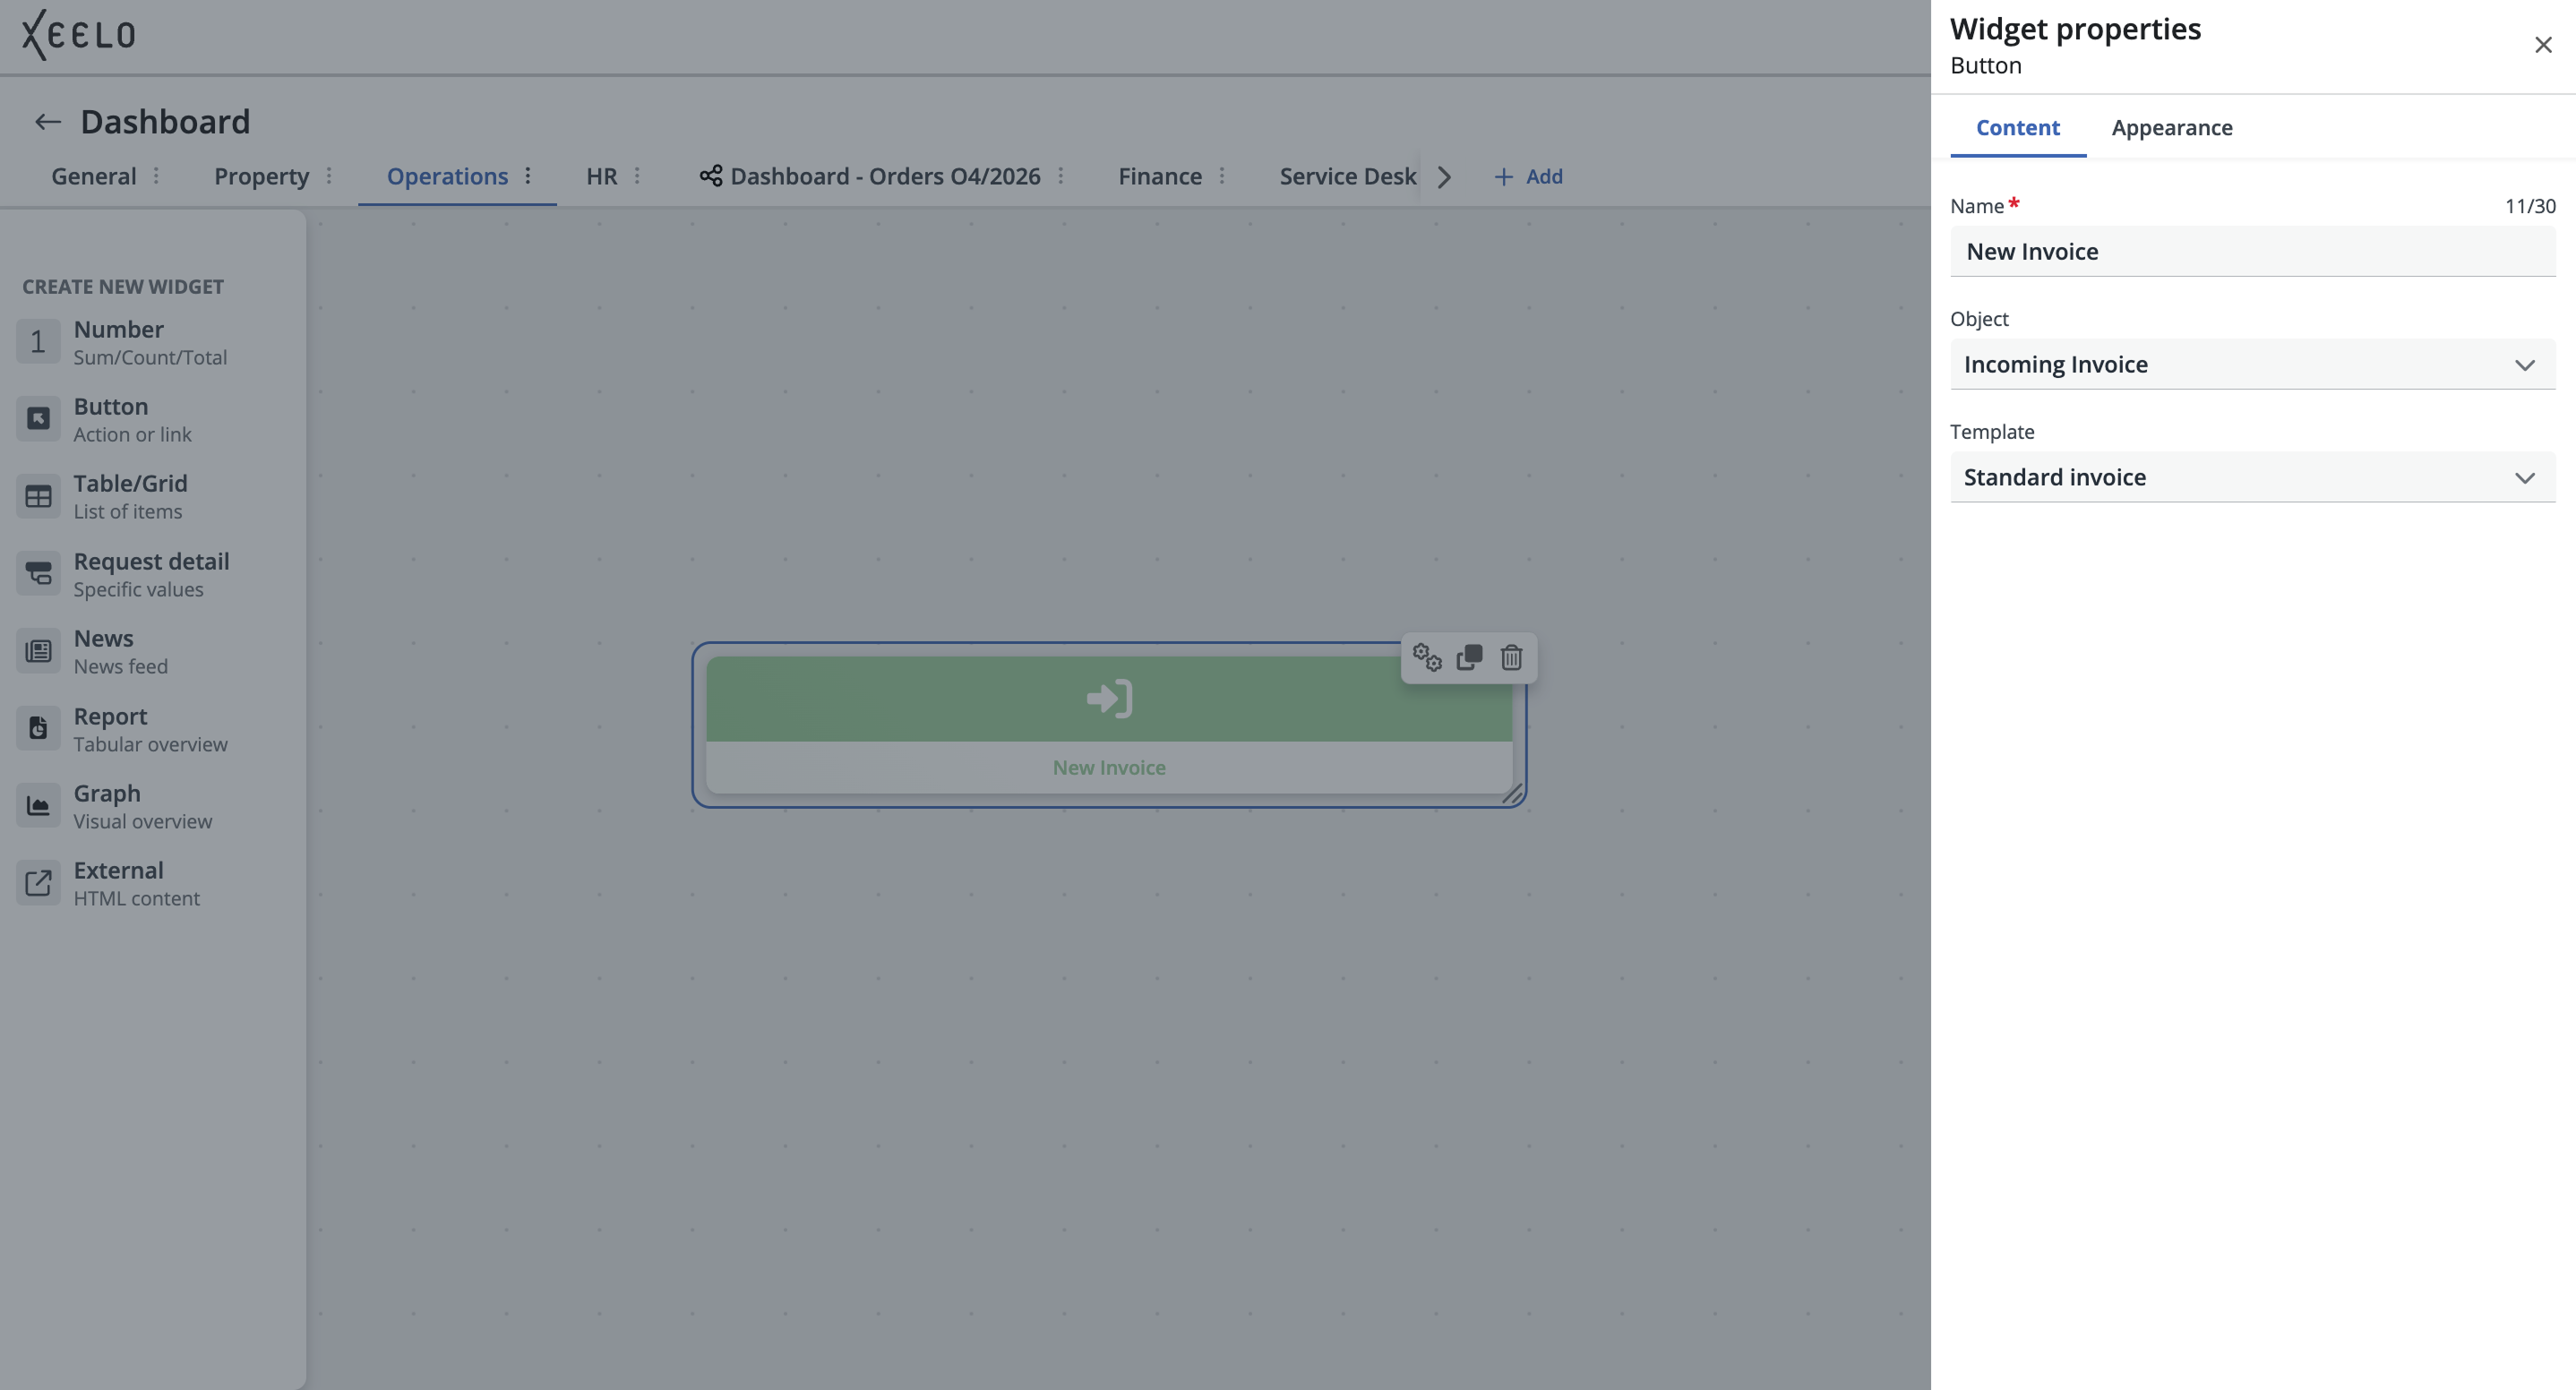
When configuring the widget, select:
-
Object – The request type you want to create using this widget (for example, Incoming Invoice, Contracts, Travel Orders, and so on).
-
Template – The specific form variant automatically loaded when the widget is used. Each template can contain different required fields, default values, or workflows. Selecting the correct template ensures that the request is created exactly as expected.
Tip
Do you frequently create the same type of request? Add the Create New Task widget with a preselected template. One click is enough to open the exact form you need.
Table/Grid
This widget displays a list of requests from a specific object (for example, Invoices or Contracts). The displayed data reflects the combination of filters configured for the widget.
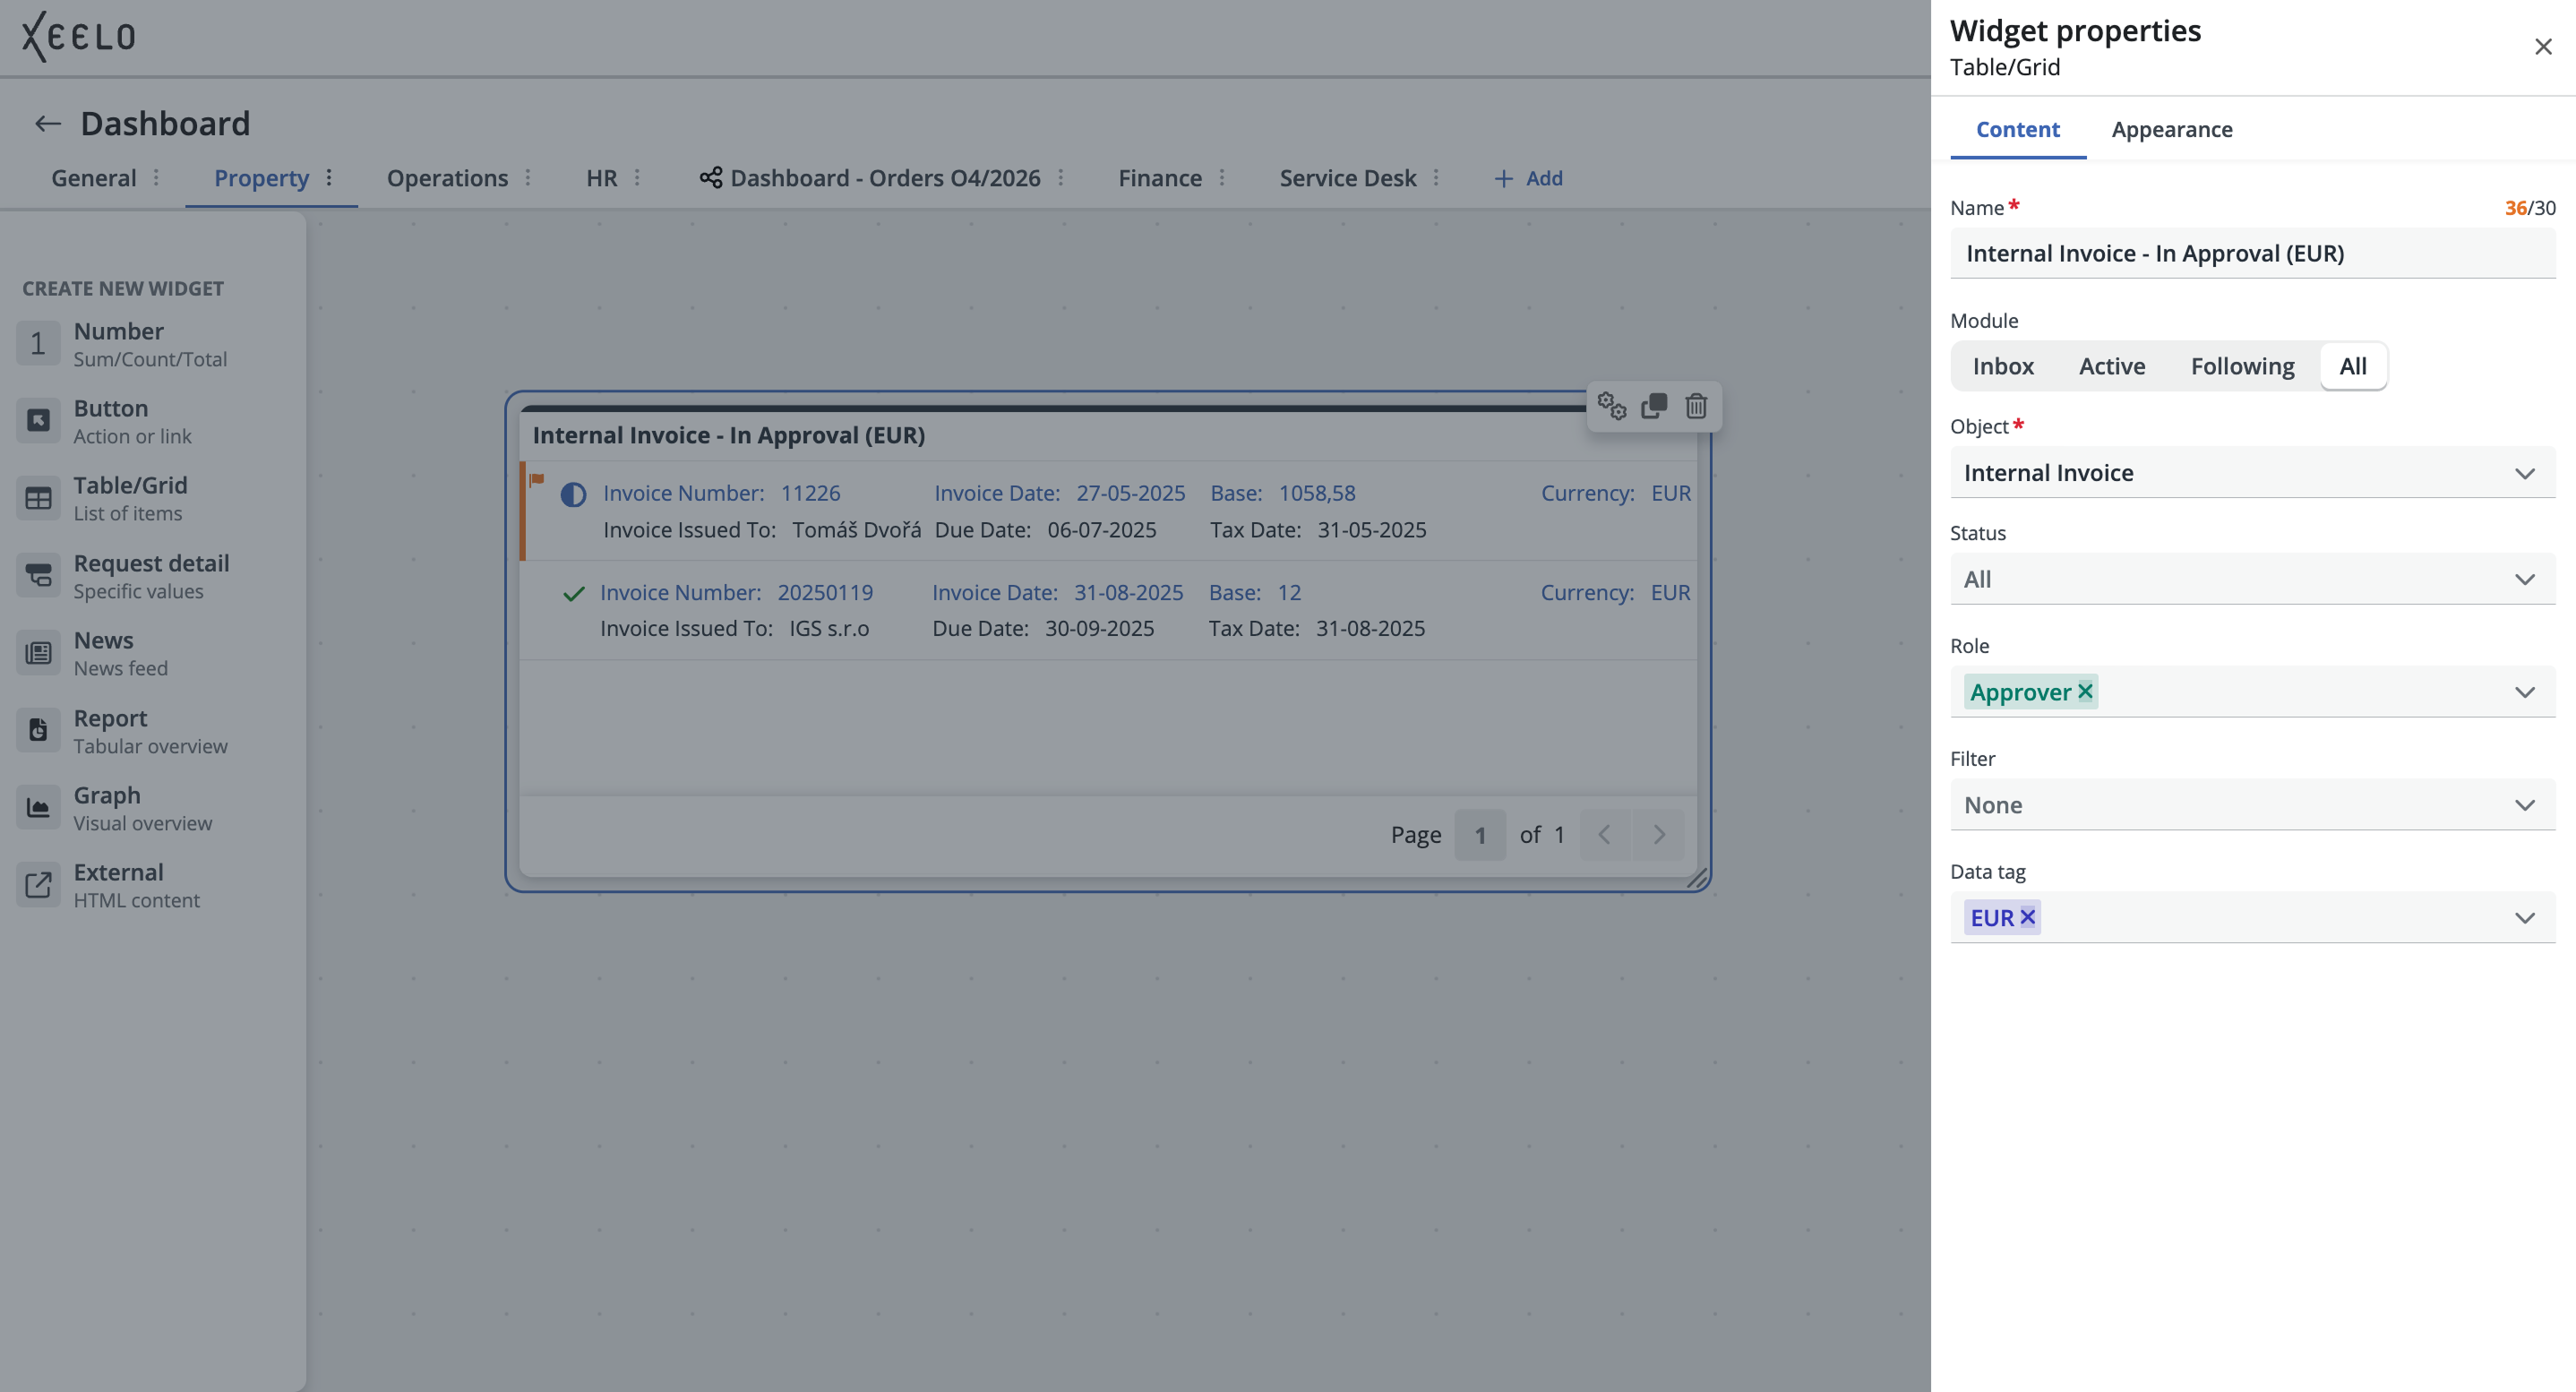
The widget configuration requires selecting:
-
Module (Inbox, Active, Following, or All).
-
Object from which you want to display requests.
You can then further refine filtering using available options (roles, statuses, tags, or saved custom filters). The result is a request overview that exactly matches what you want to monitor on the dashboard.
Tip
Create a custom widget focused on high-priority requests or requests with exceeded processing deadlines.
Having a quick overview of these critical items directly on the dashboard helps you manage work more efficiently and avoid unnecessary delays.
Request Detail
This widget provides quick access to a specific request detail. It allows you to pin a selected record to the dashboard and keep it constantly visible. Clicking the widget opens the request in a new window.
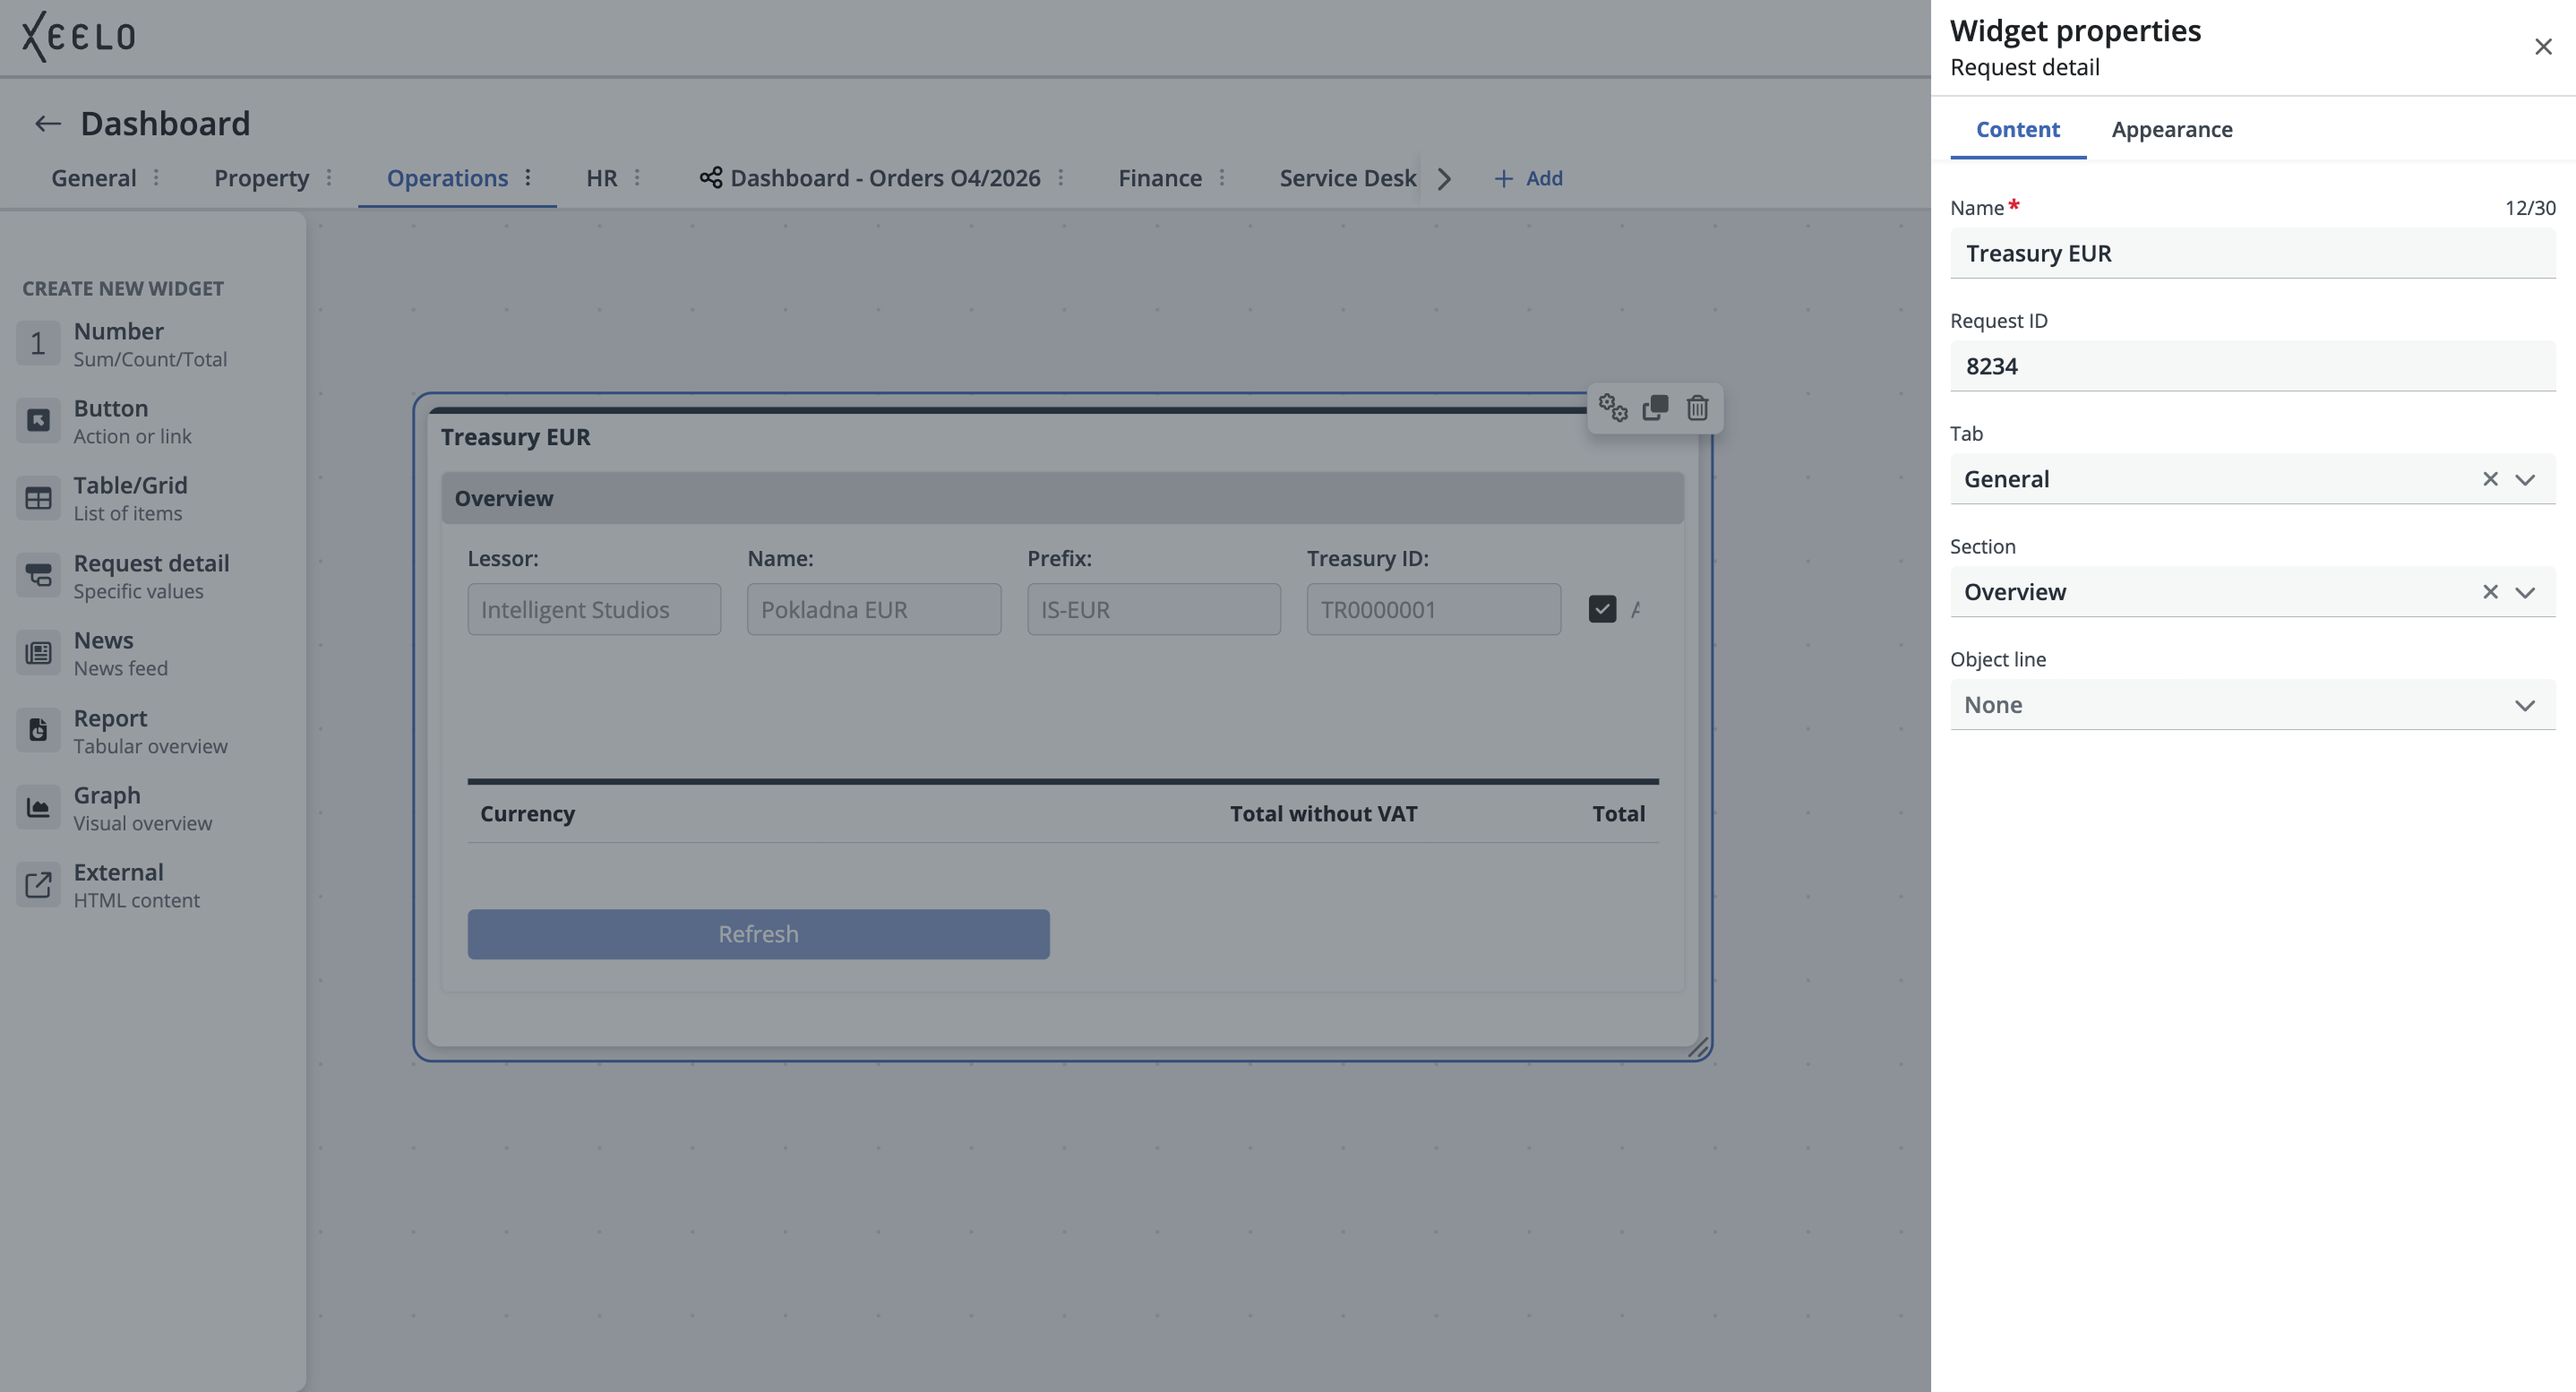
Widget configuration:
-
Request ID – Enter the ID of the request you want to display on the dashboard. The widget cannot be displayed without this information. Information about where to find the request ID is available here.
-
Tab, Section, Object Line – These options allow you to narrow the displayed request only to the part you actually need to monitor — for example, a specific approval tab, a section with financial data, or a single field containing a deadline.
Tip
Do you repeatedly work with one important request? Pin it to the dashboard and display only the information you care about most — such as the current status, final amount, or approval section. No more lengthy searching — key information is always visible.
News
This widget is used to display important announcements published by an administrator. Users gain an overview of new features, process changes, or other updates directly on their dashboard.
News content is typically managed in the administration interface. If the implementation allows users with appropriate permissions to manage news, messages can also be created, edited, and published directly from the user interface.
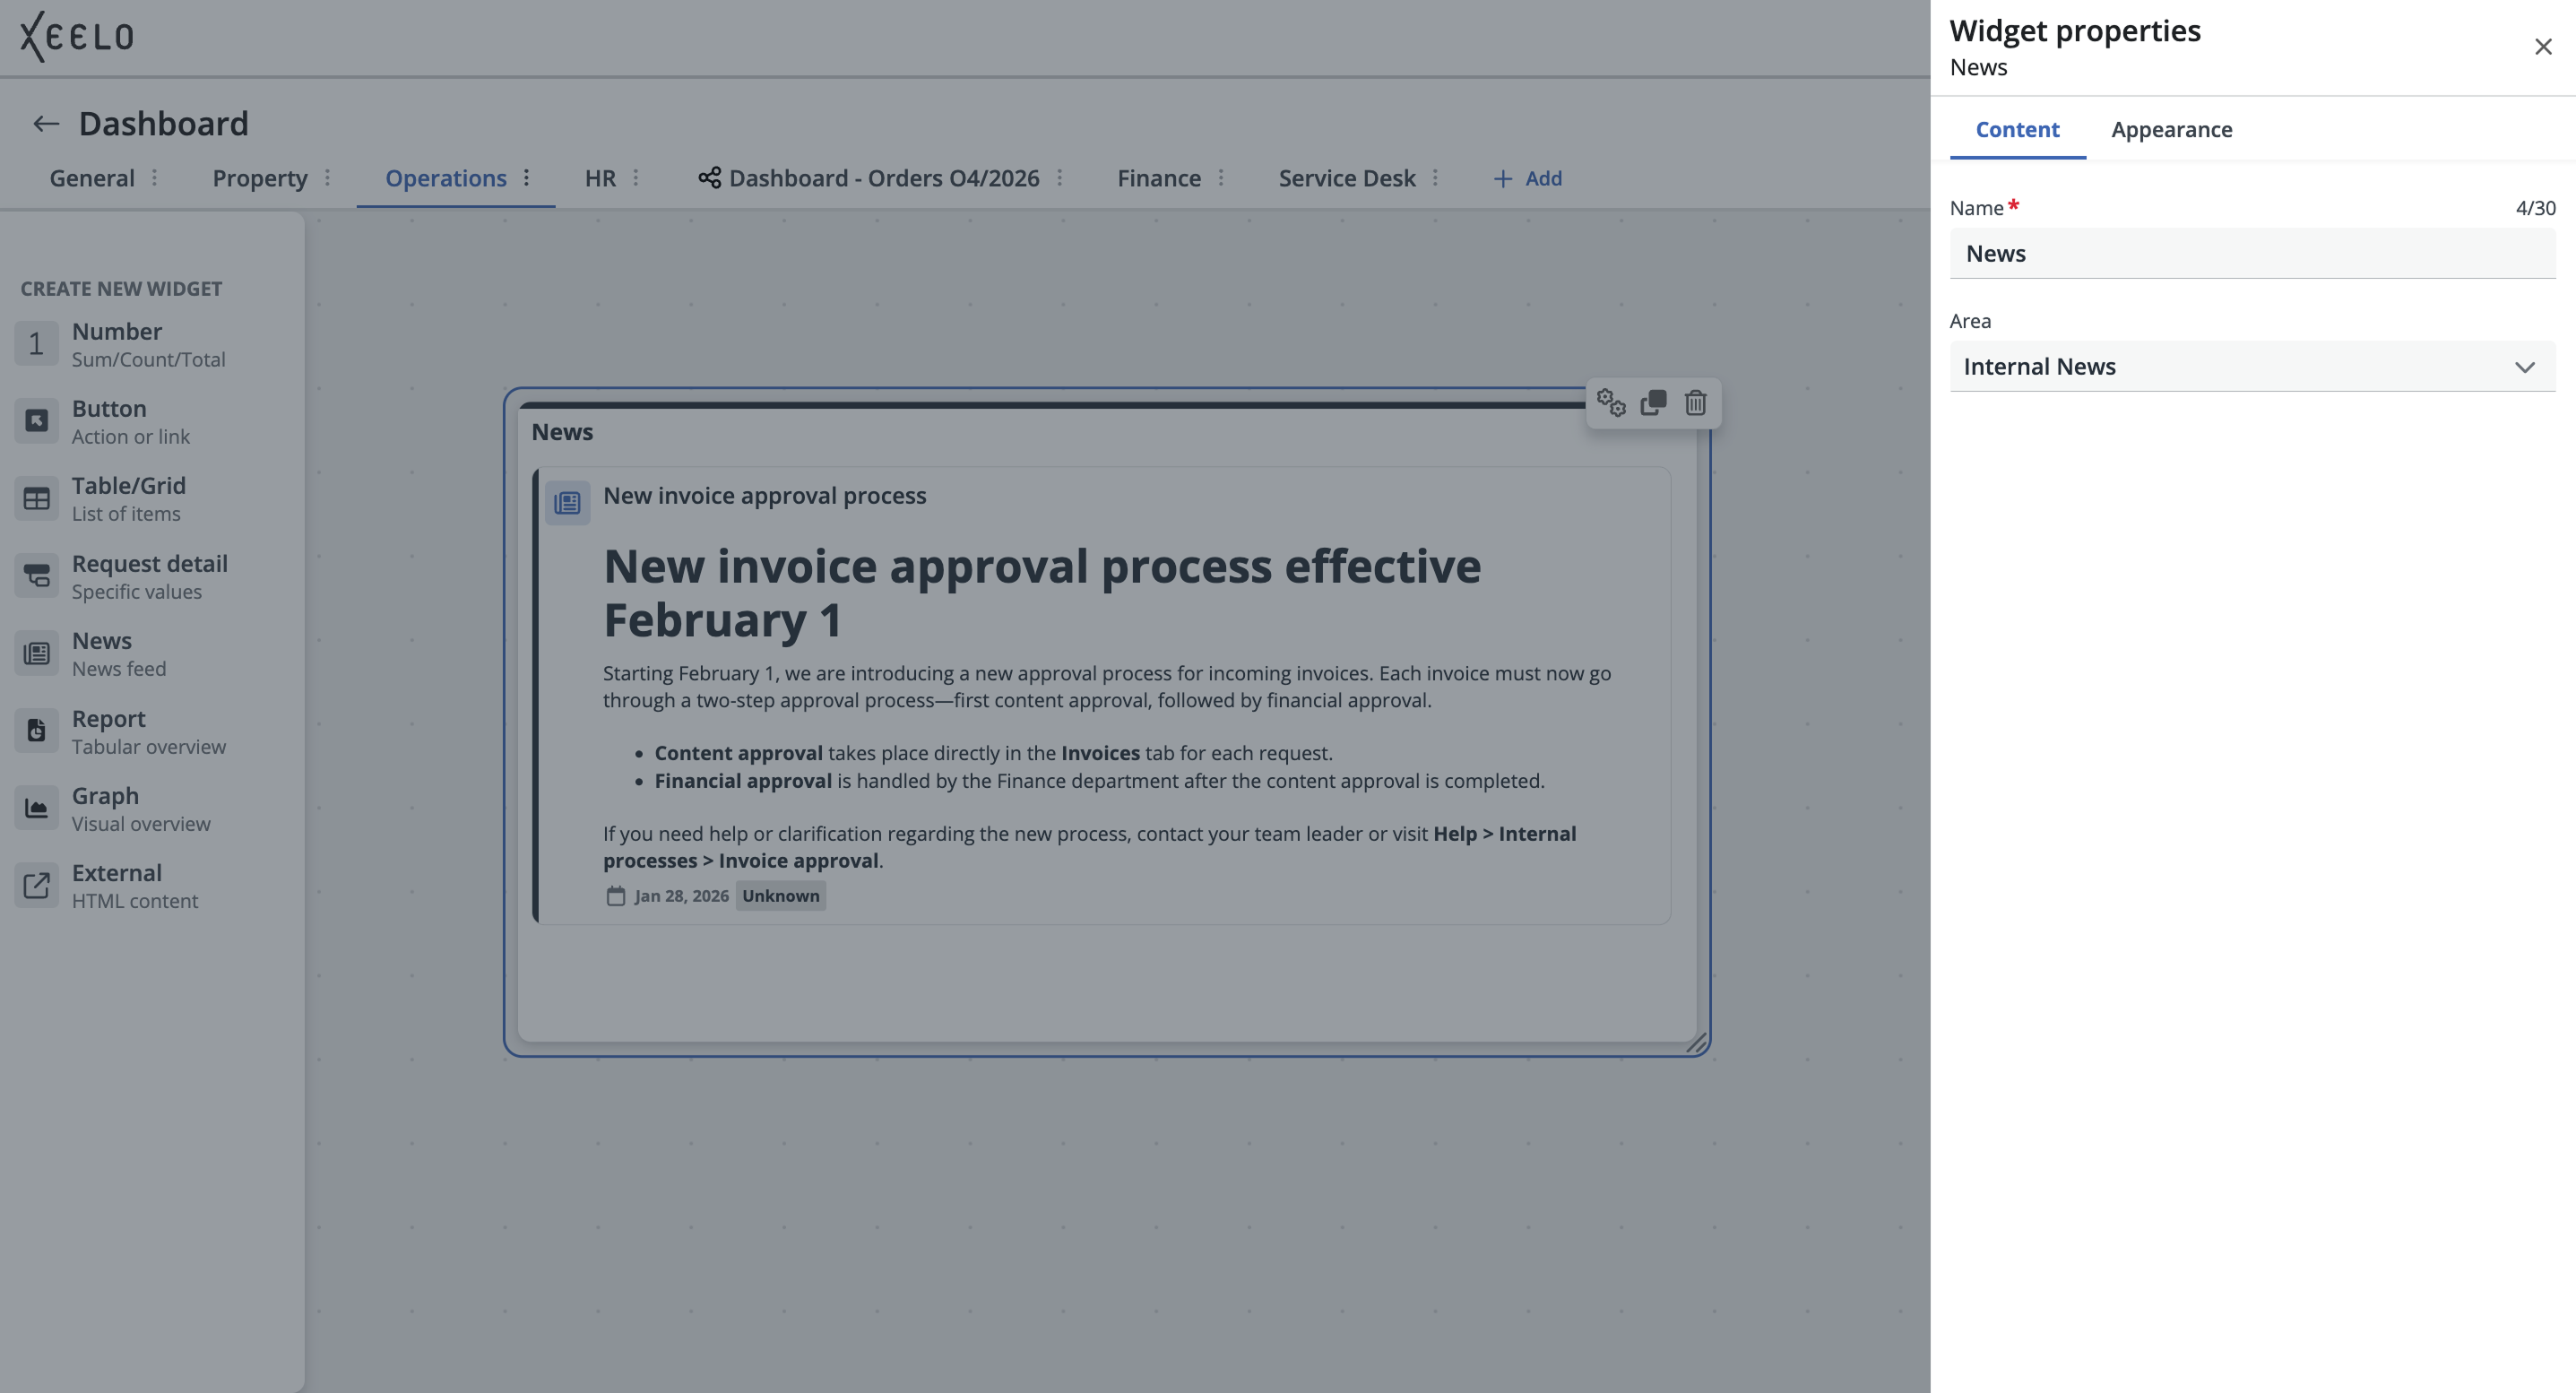
During configuration, select:
- Area from which the news should be displayed.
Tip
Use News as a central location for internal announcements. Team updates, configuration changes, or important notifications are always available directly on the dashboard.
Report
This widget displays the output of a preconfigured report directly on the dashboard. The displayed content depends on the report prepared by the administrator — for example, a summary table, data overview for a selected period, or output from a custom data analysis.
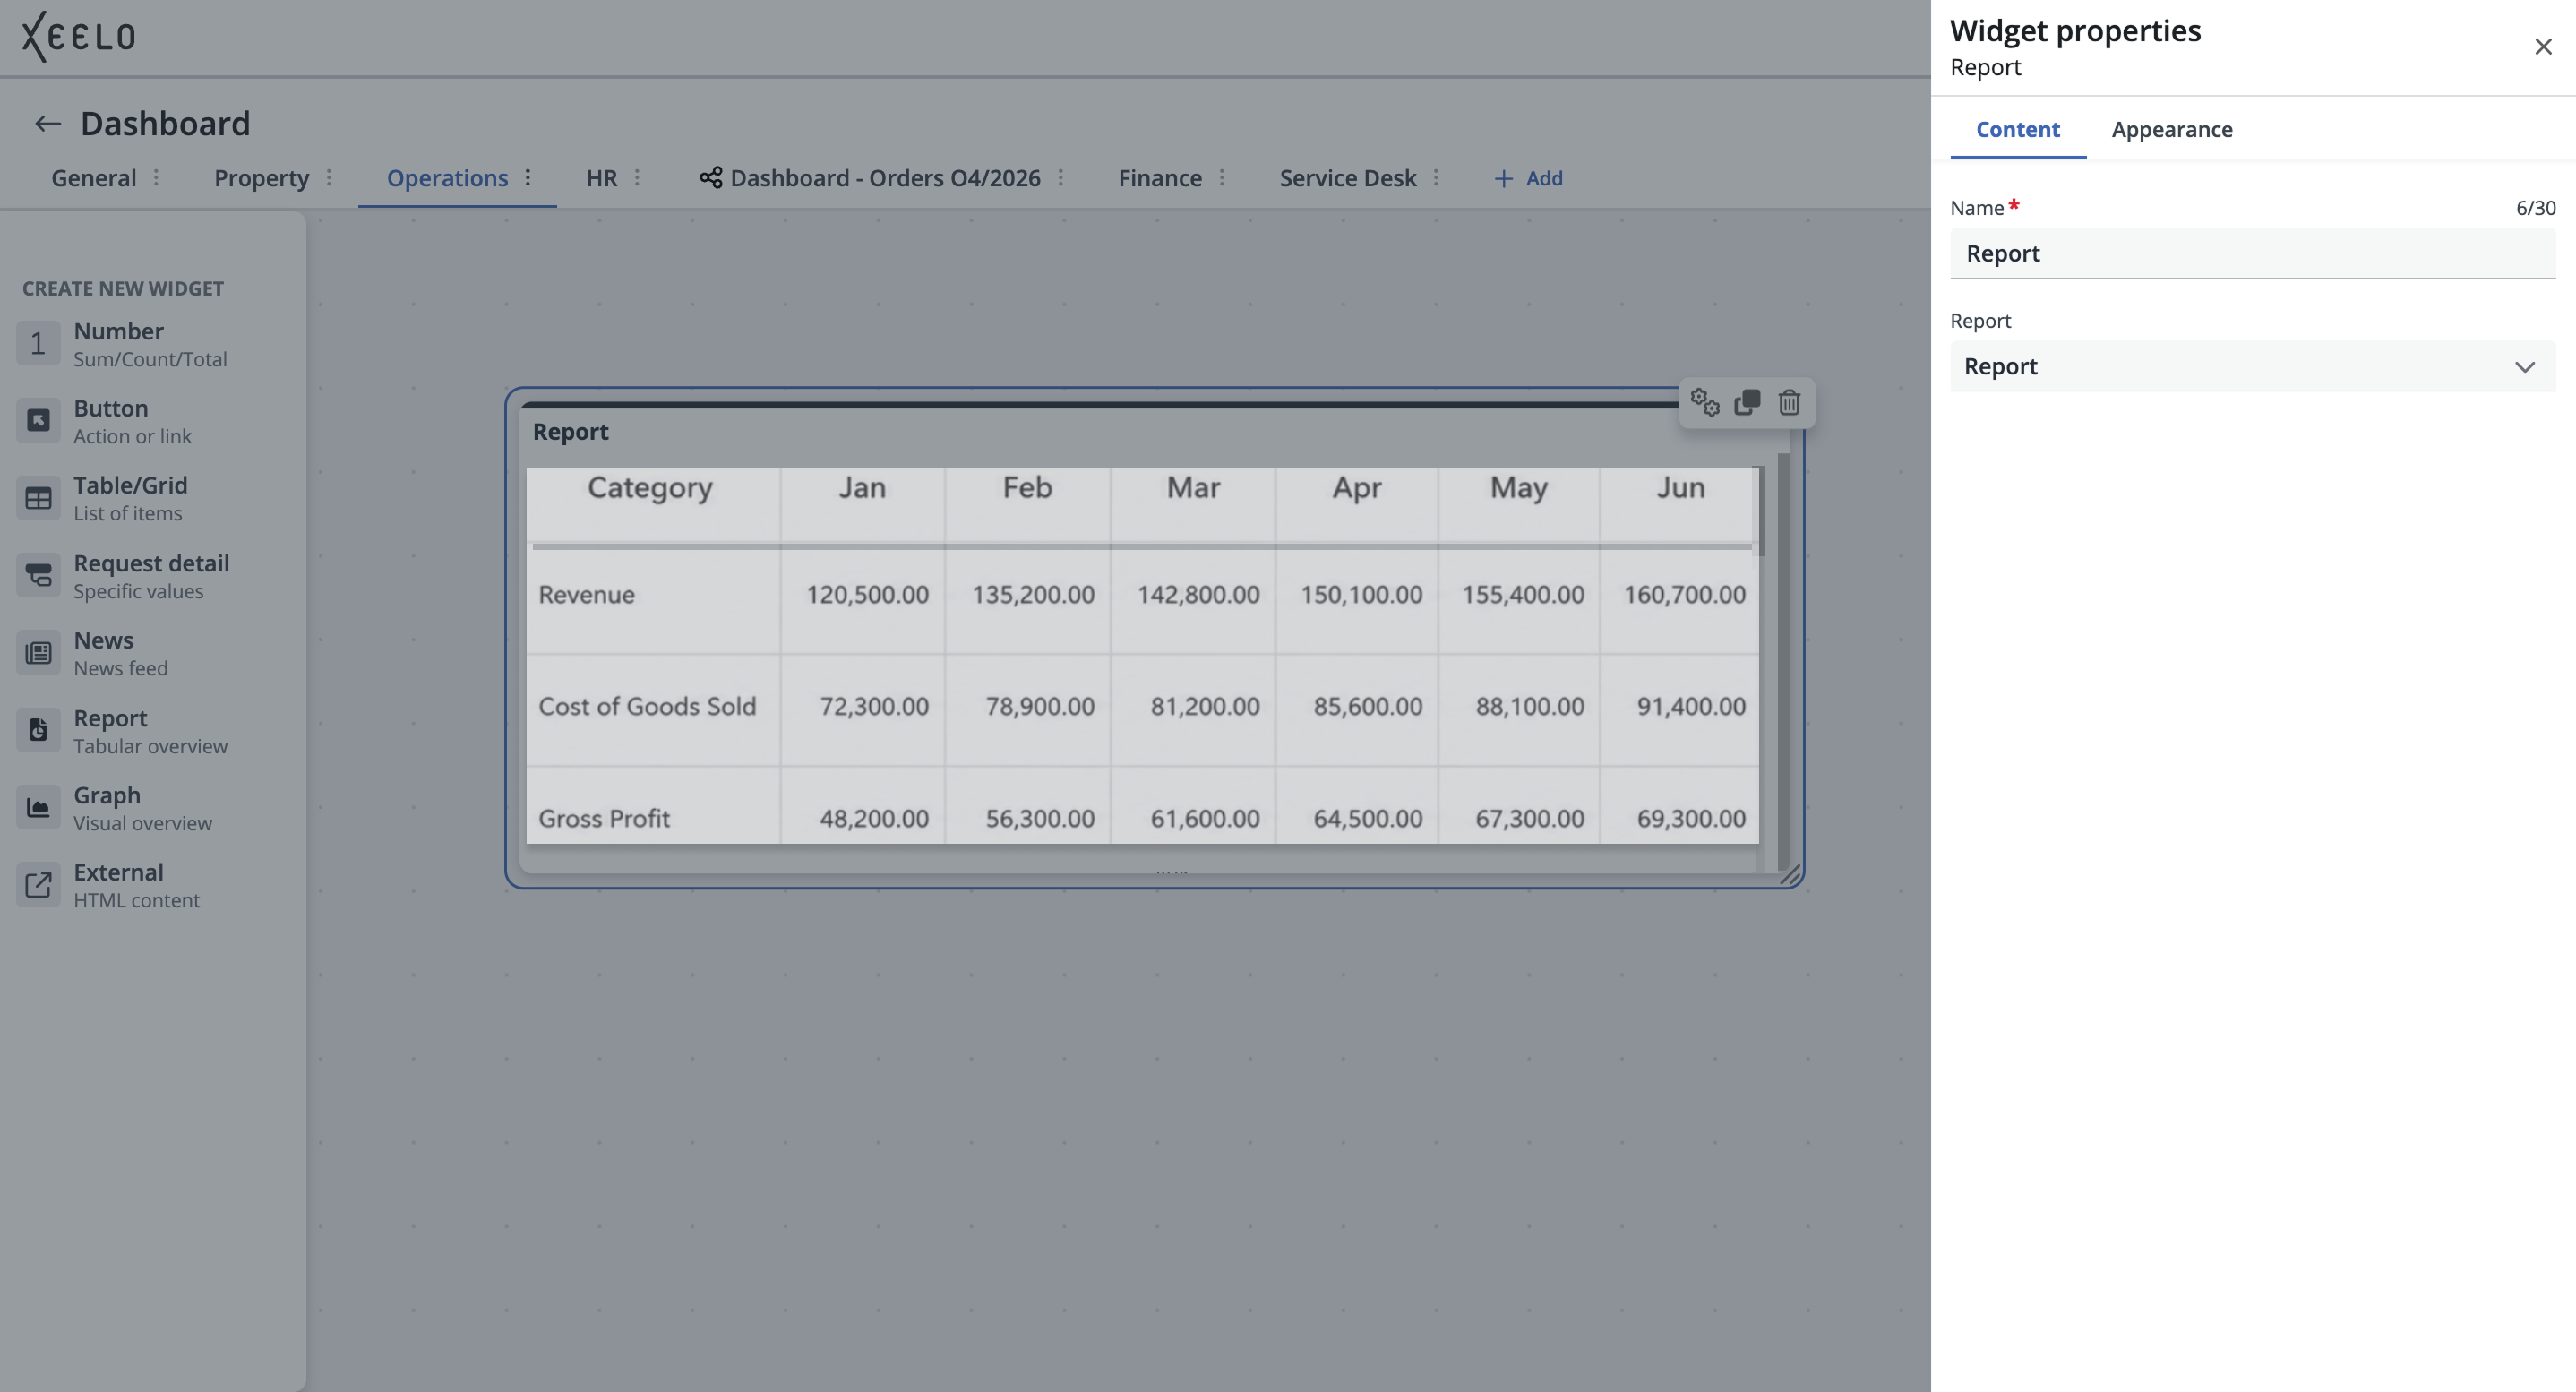
In the widget configuration, select:
- Report from the list of available reports. No additional configuration is required — the widget automatically loads data according to the current report state.
Tip
Do you need to keep track of monthly electricity consumption, cost development, or another regularly monitored metric? If the report is prepared by the administrator, you can easily add it to your dashboard.
Graph
This widget visualizes a selected dataset in graph form depending on how the graph was configured by the administrator. It is especially useful for monitoring trends, comparing values, or quickly understanding data development over time.
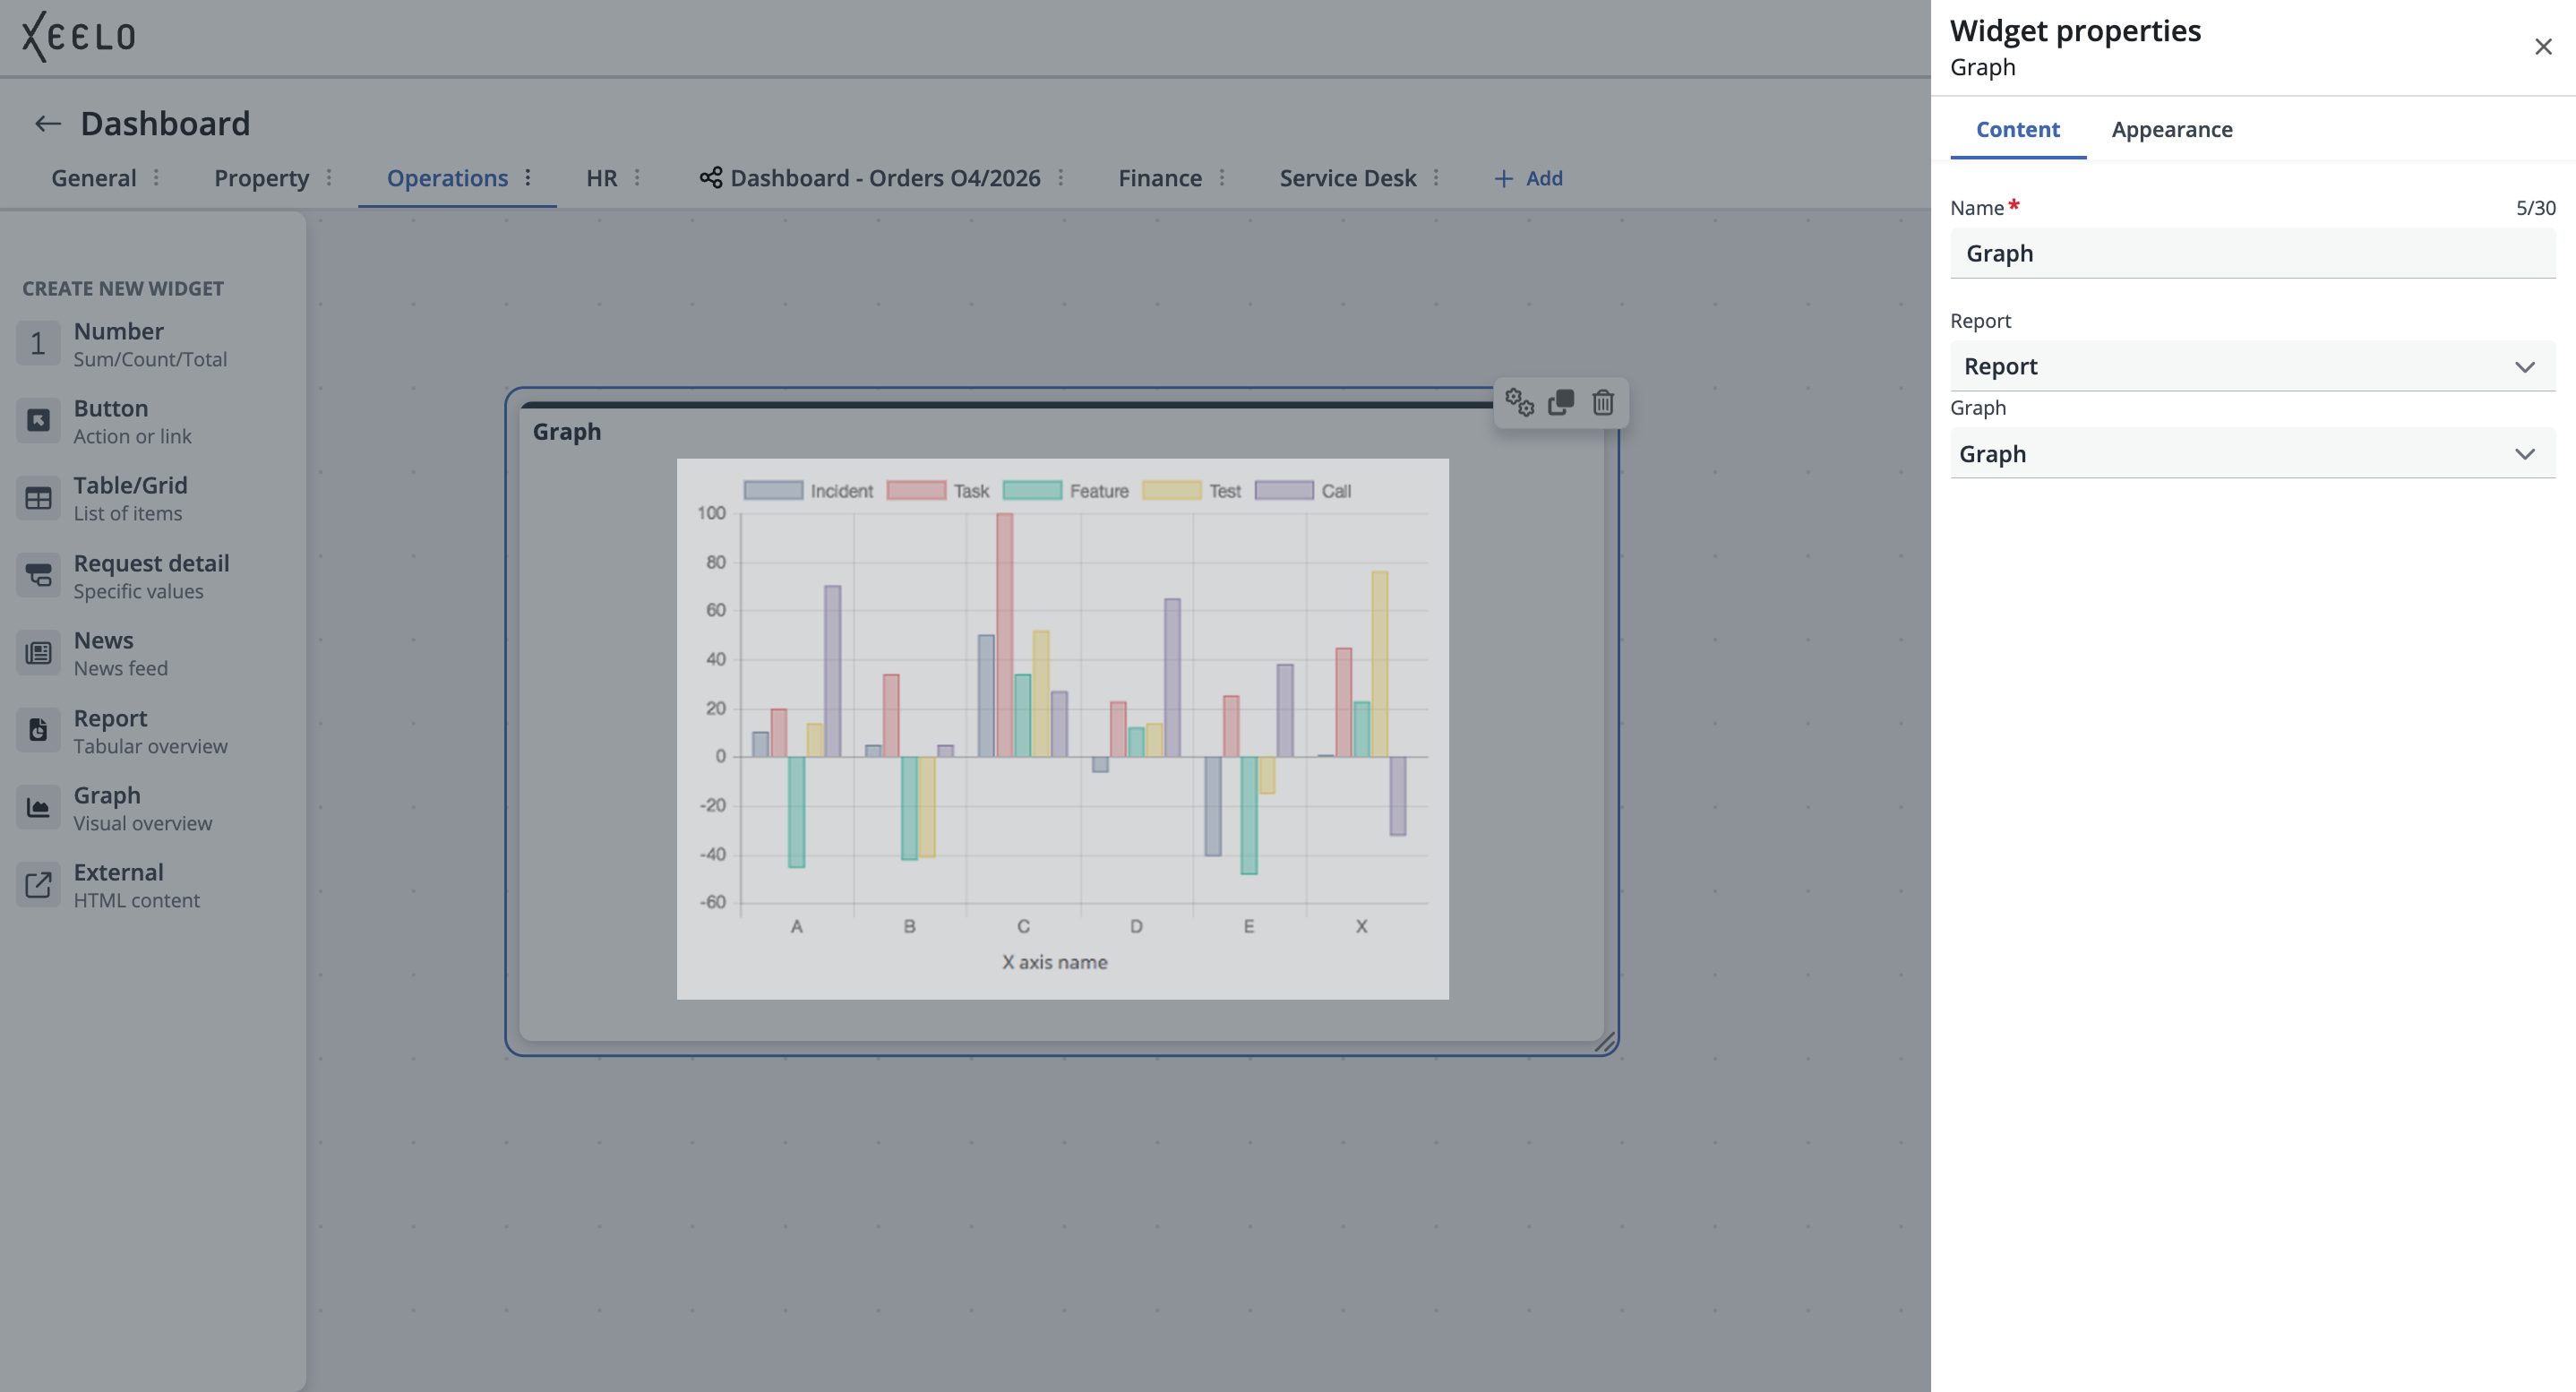
During configuration, select:
-
Report from the list of available reports. No additional configuration is required — the widget automatically loads data according to the current report state.
-
Graph prepared by the administrator. If the field is empty, no graphs are currently available in the system or your permissions do not allow graph access.
Tip
Monitor key indicators clearly and visually. Using the graph widget, you can display cost development, the number of new requests, or department comparisons directly on your dashboard at a glance.
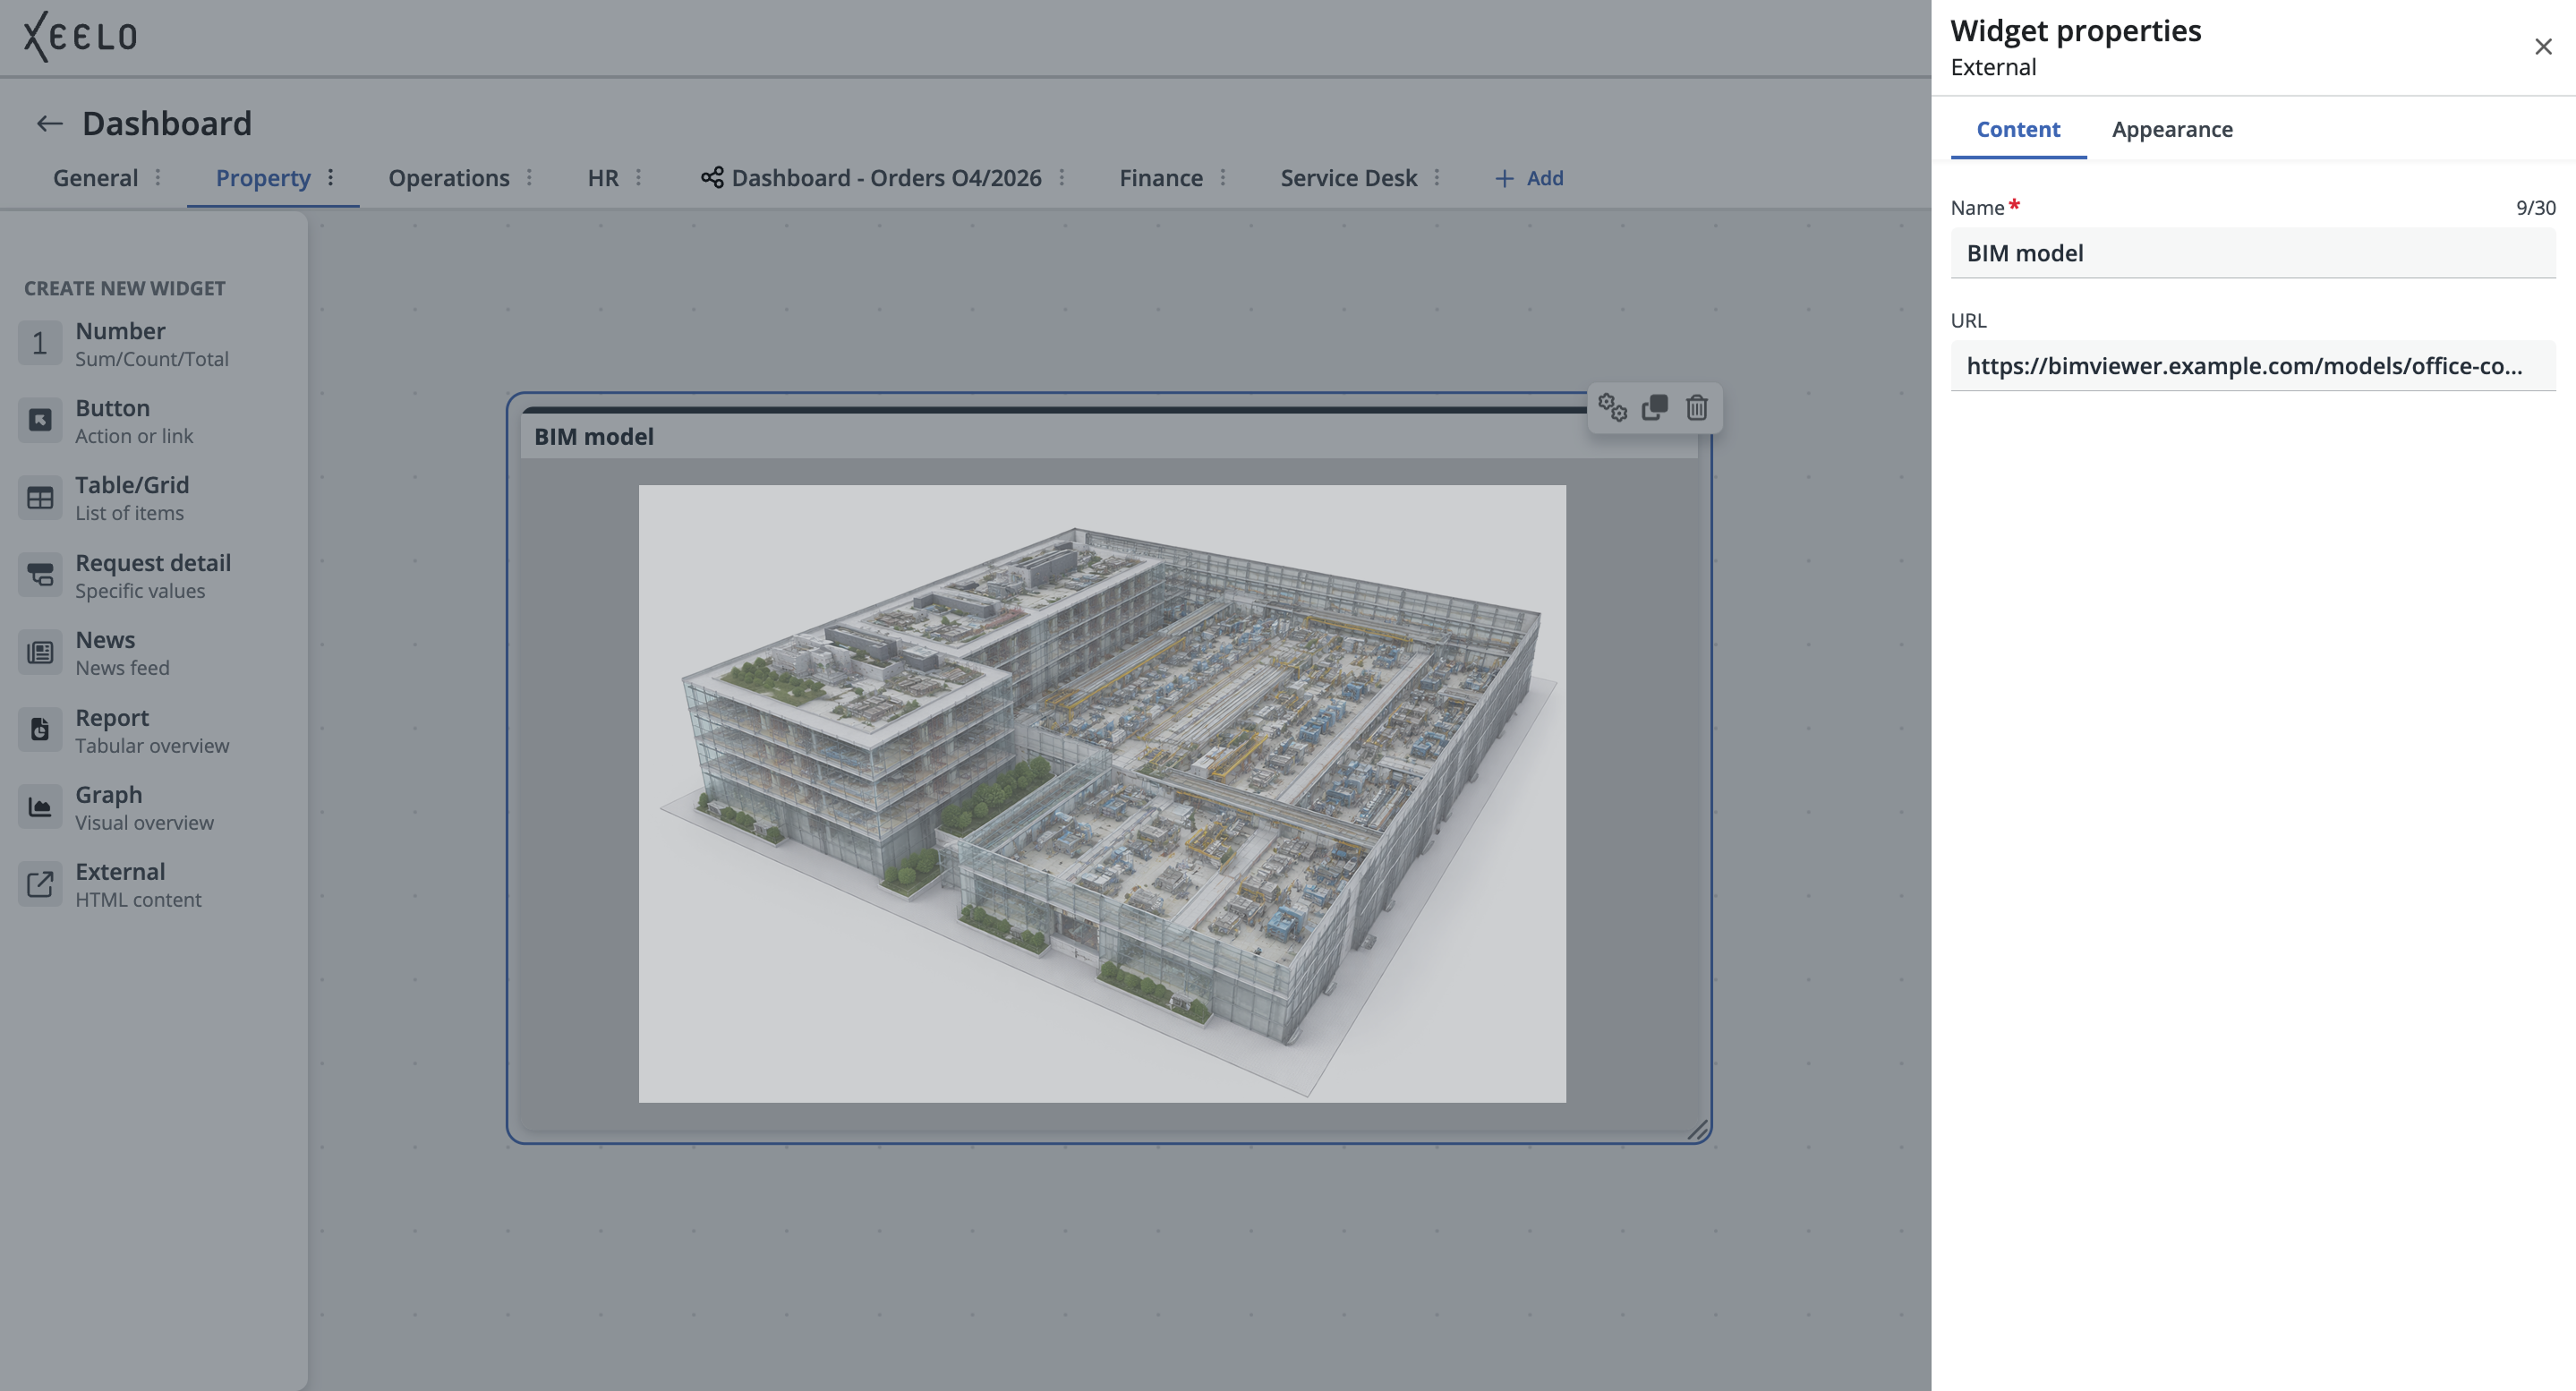
External
This widget is used to display a link to an external website or system that you want to actively use directly from the dashboard. After adding the link, the content is displayed directly inside the widget as an interactive element — allowing you to complete forms, sign in to another application, or display live data without leaving the Xeelo environment.
During widget configuration, enter:
- URL Address that will be displayed as an interactive element on your dashboard. For security reasons, only links pointing to domains approved by the administrator can be used.
Using the External widget
Do you need quick access to an external application, portal, or visualization? Add a link to your dashboard — for example, an online BIM building model. The model is displayed directly within the widget and allows interactive work without leaving the platform.
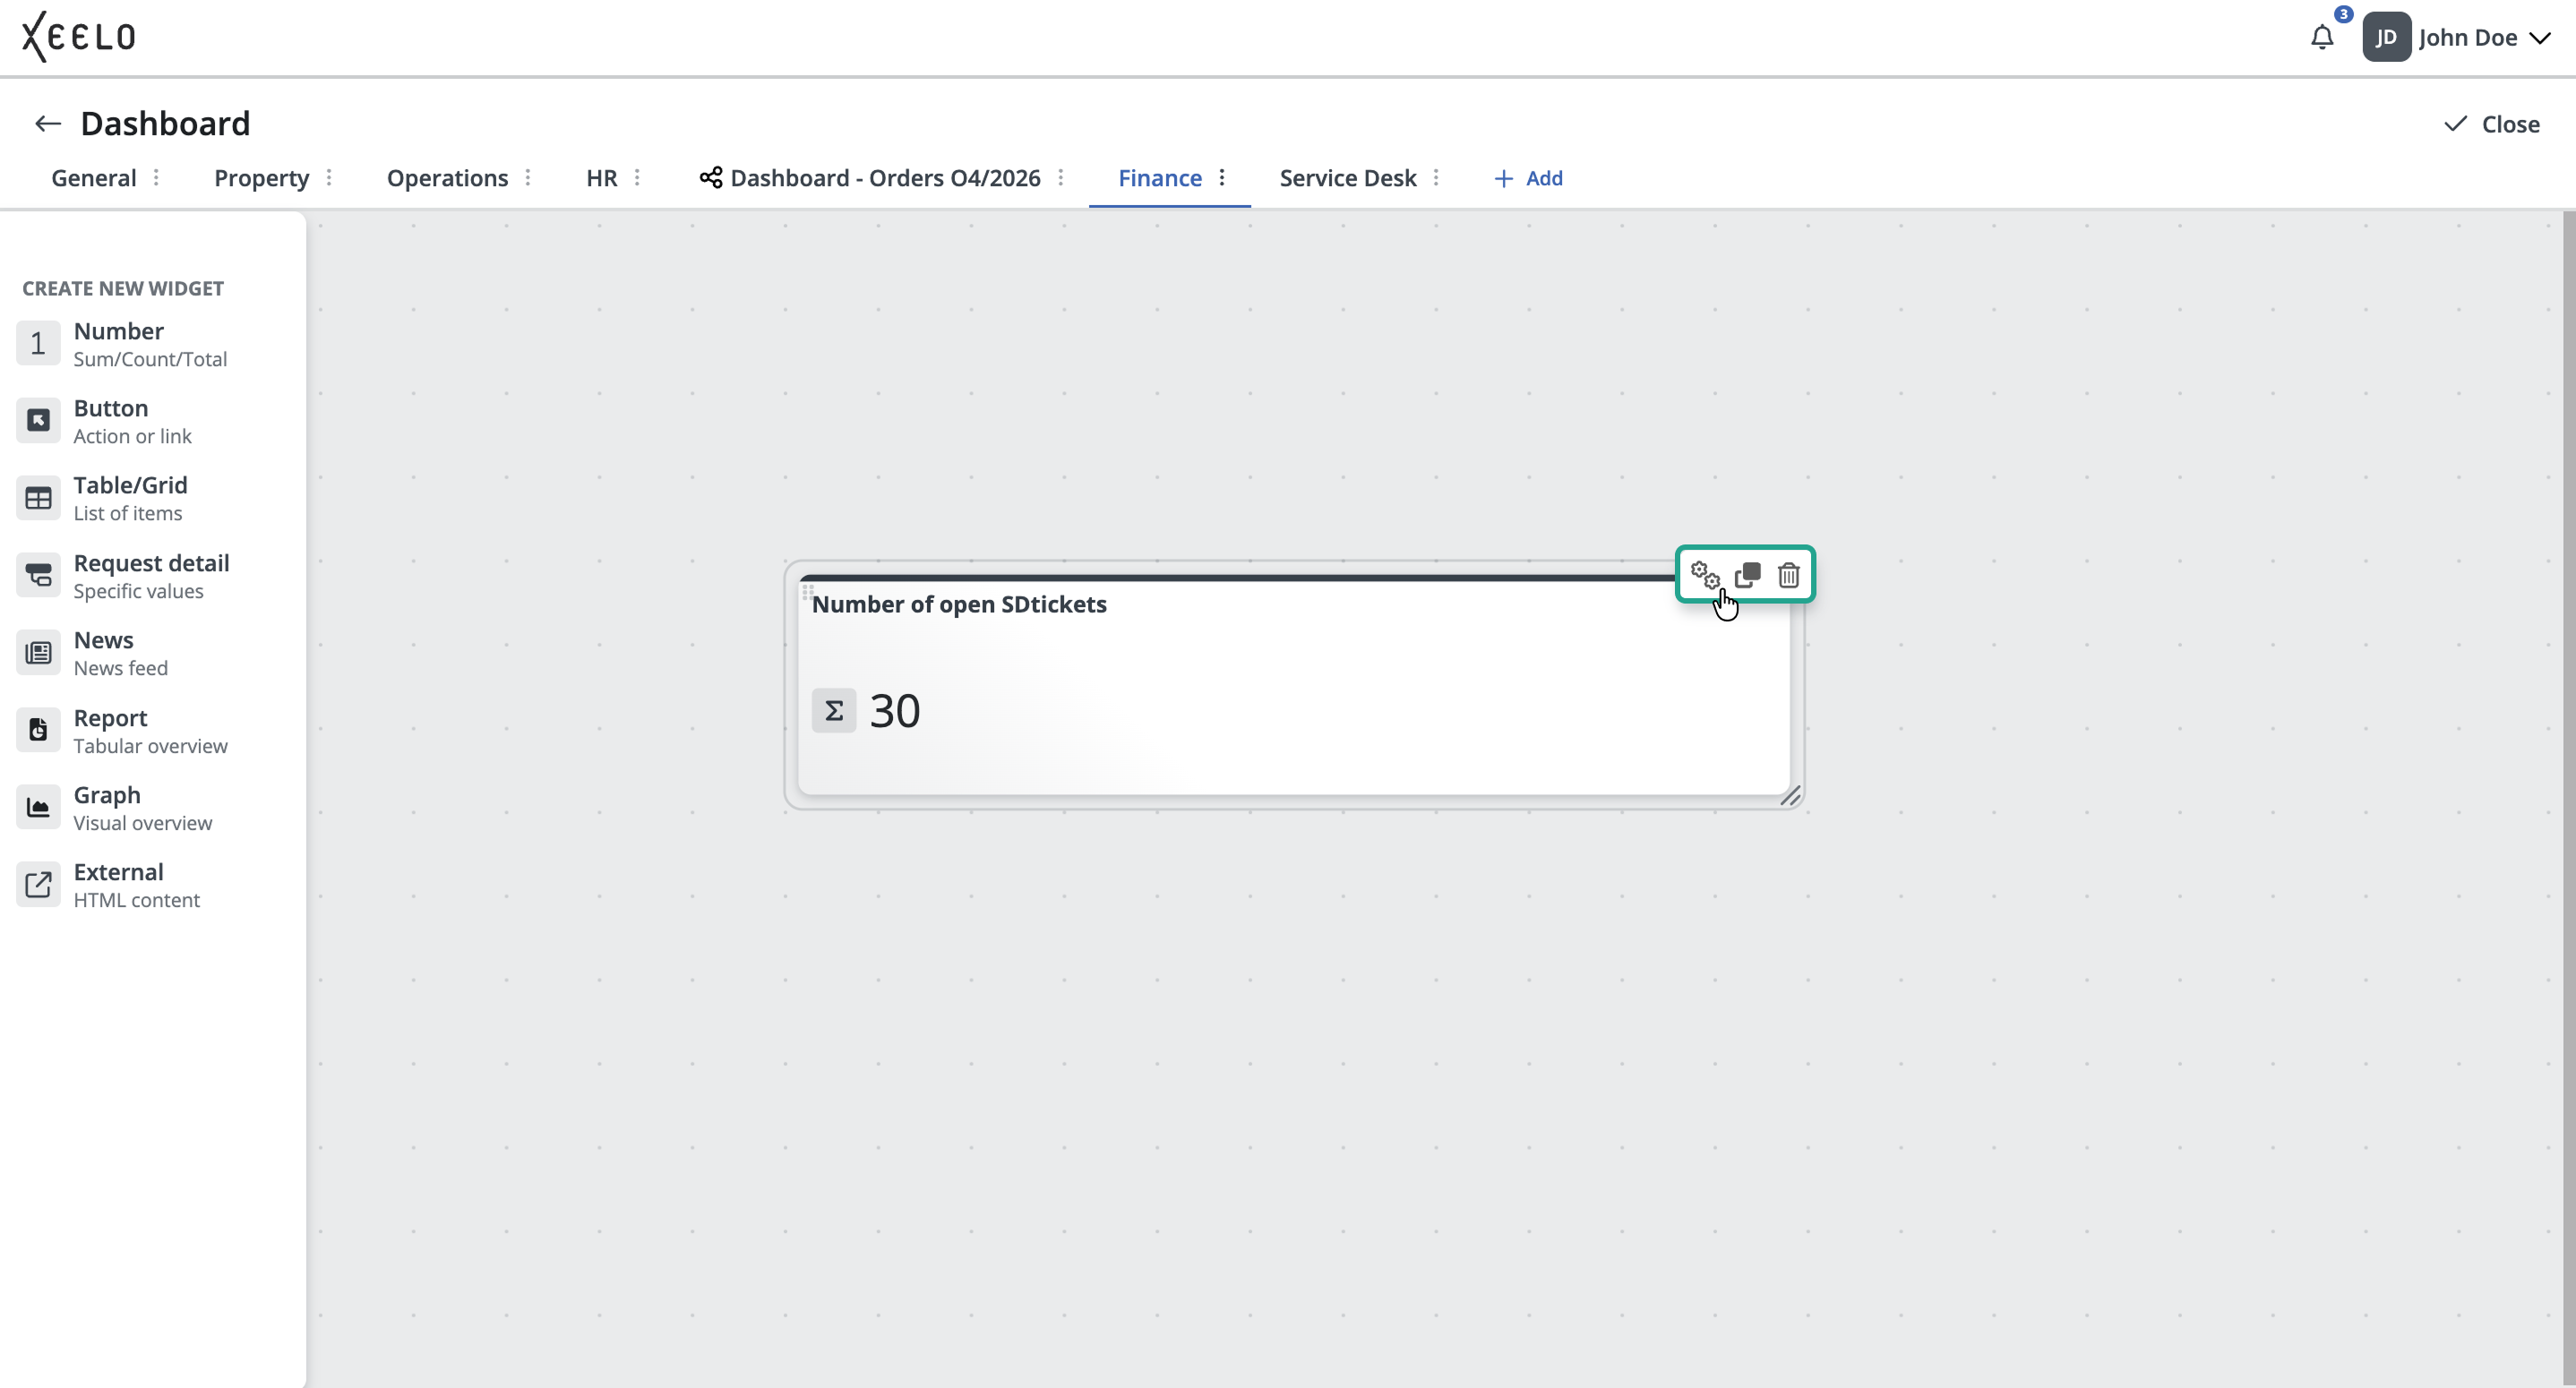
Widget management
In dashboard edit mode, you can modify individual widgets. Hovering over a widget displays a list of available actions in the upper-right corner:
-
Edit: Opens the settings panel where you can modify widget configuration or change the displayed content.
-
Copy: Creates a copy of the current widget, including its settings. This option is useful when you want to create a similar widget with different filtering or another data source.
-
Remove: Removes the widget from the dashboard. After deletion, the widget disappears from the dashboard workspace and its configuration is removed.
After clicking Edit, the edit panel opens. The panel is divided into two main tabs:
Content - Used to configure the widget content itself. Available options differ depending on the widget type, but typically include:
- widget name
- data source or object
- view type
- filtering
- or additional parameters
Appearance - Used to configure the visual appearance of the widget. For example:
- widget color,
- or additional visual options available for the selected widget type.
Some widgets may also provide advanced settings here, such as conditional value highlighting or specific data display options.
Creating a widget from the request overview
You can also create a widget directly from the request grid. This method is especially useful when you already have custom filtering configured and want to quickly display the current view on the dashboard.
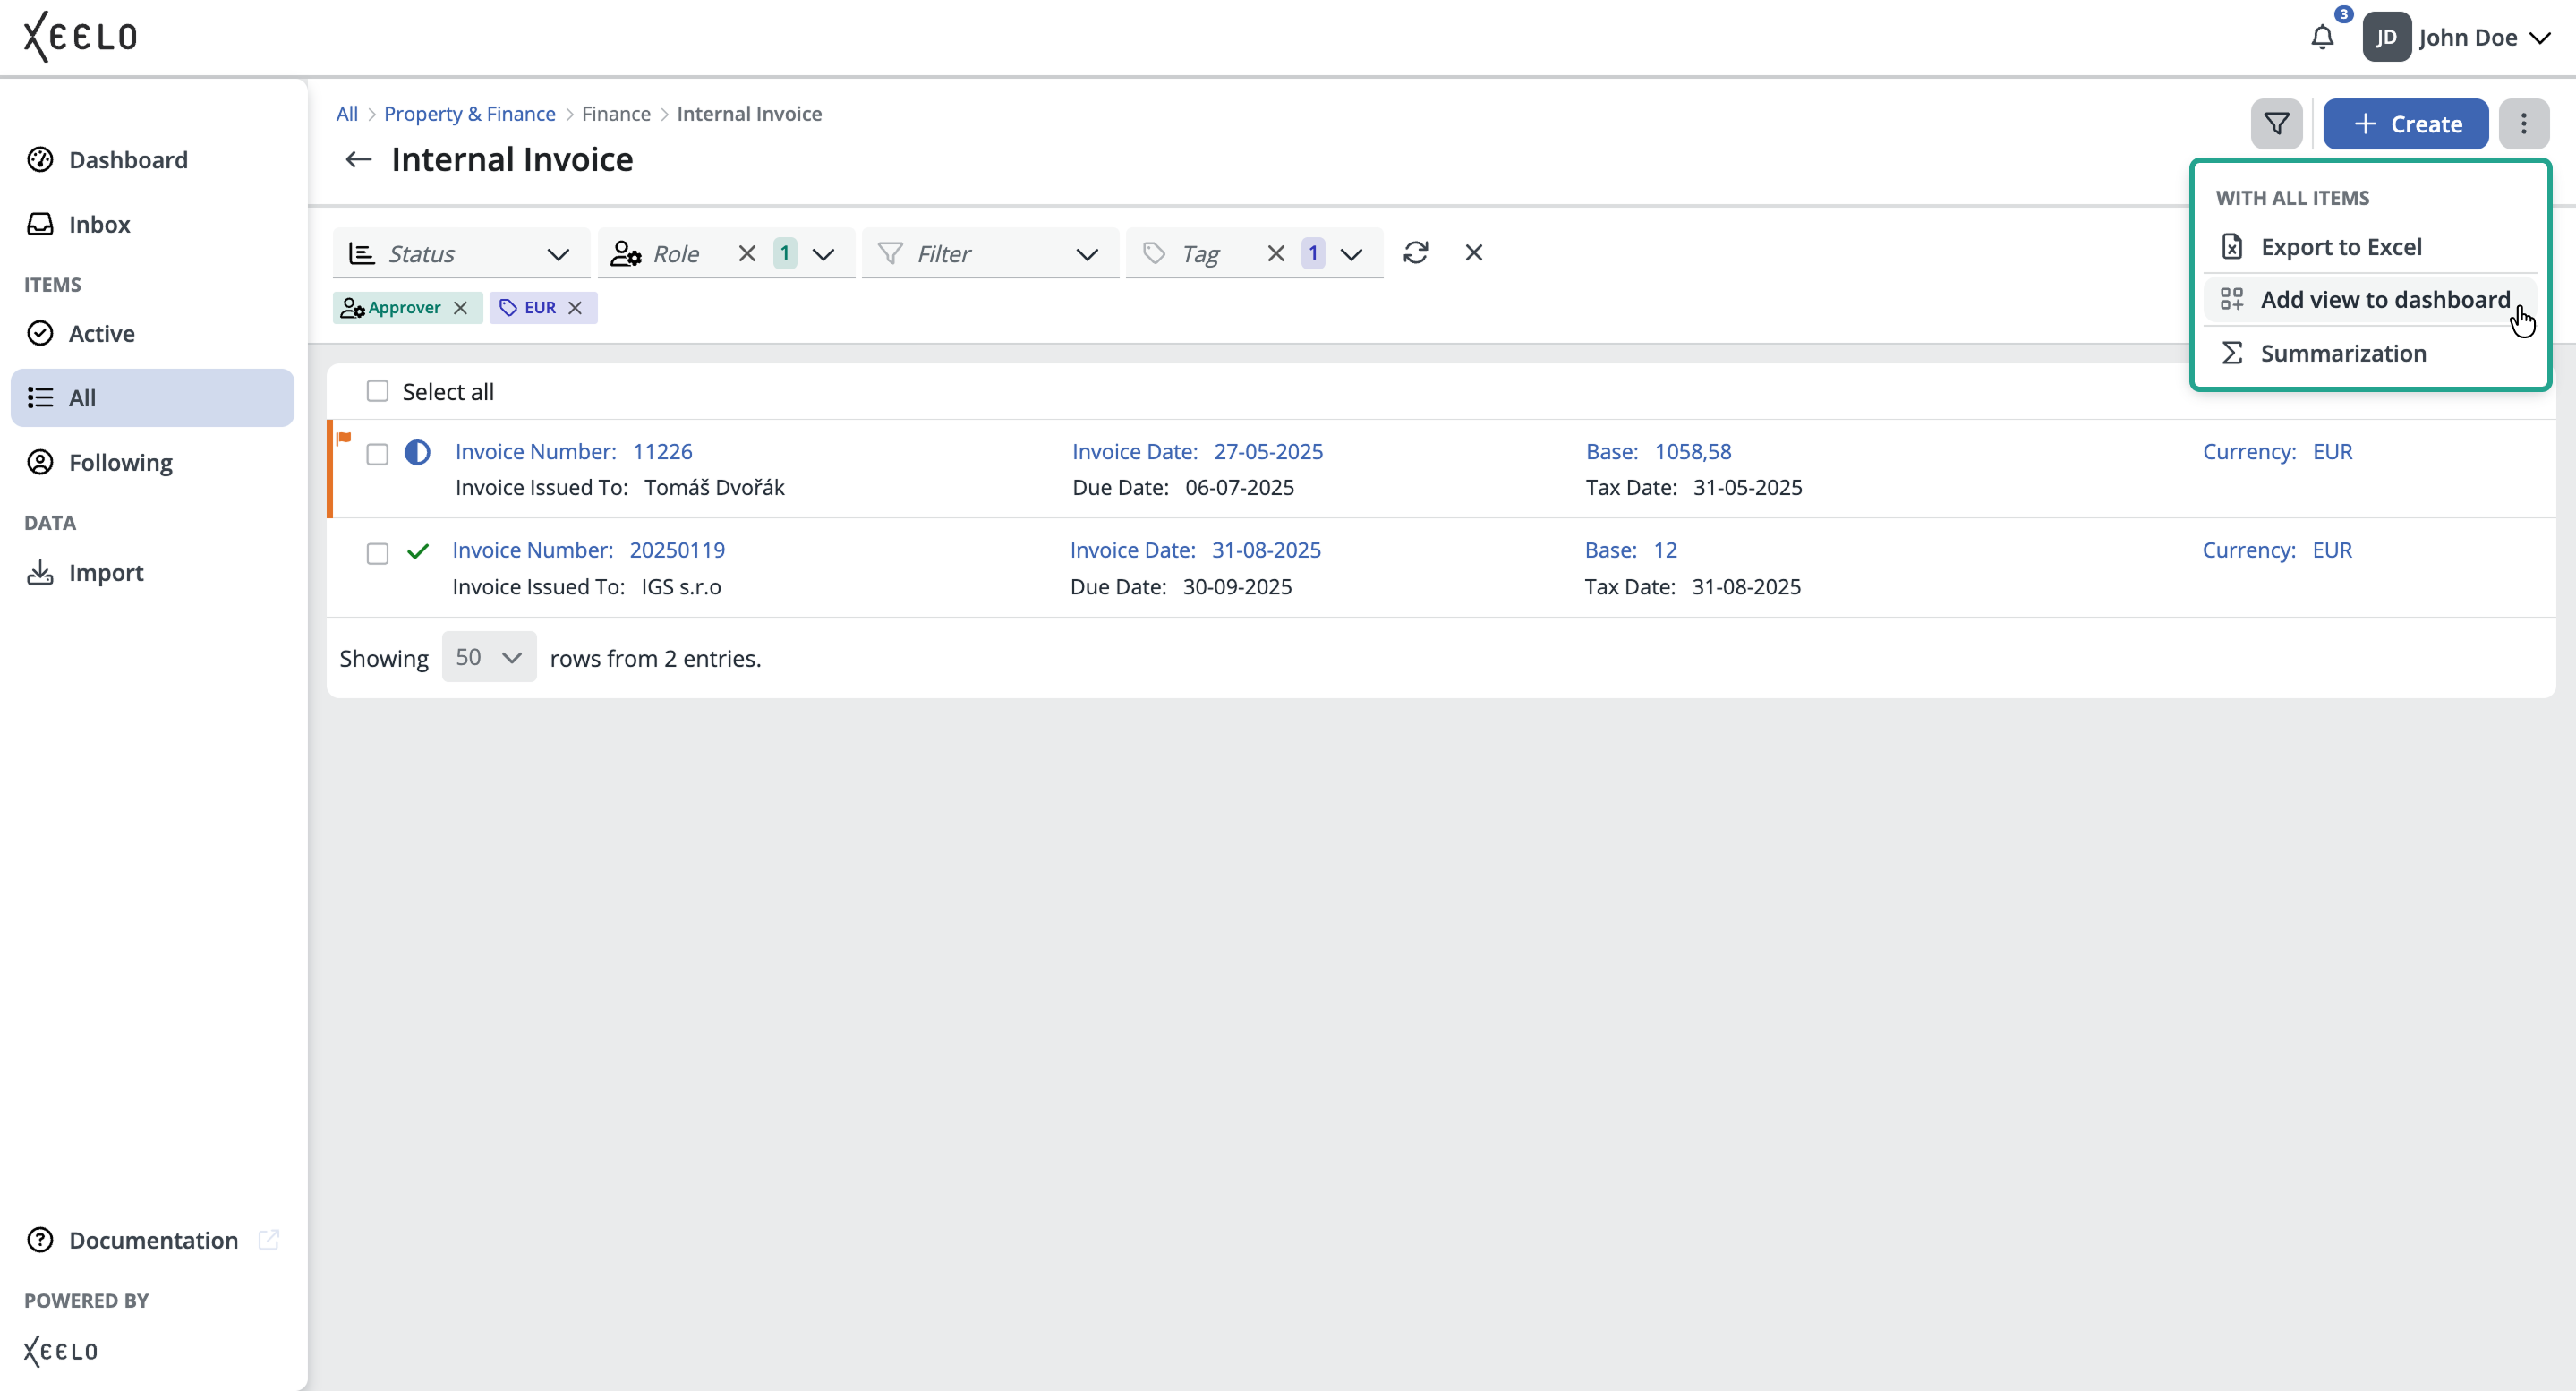
In the request grid, click the menu under the three-dot button in the upper-right corner and select Add view to Dashboard. A window then opens where you select:
- widget type
- widget name
- target dashboard
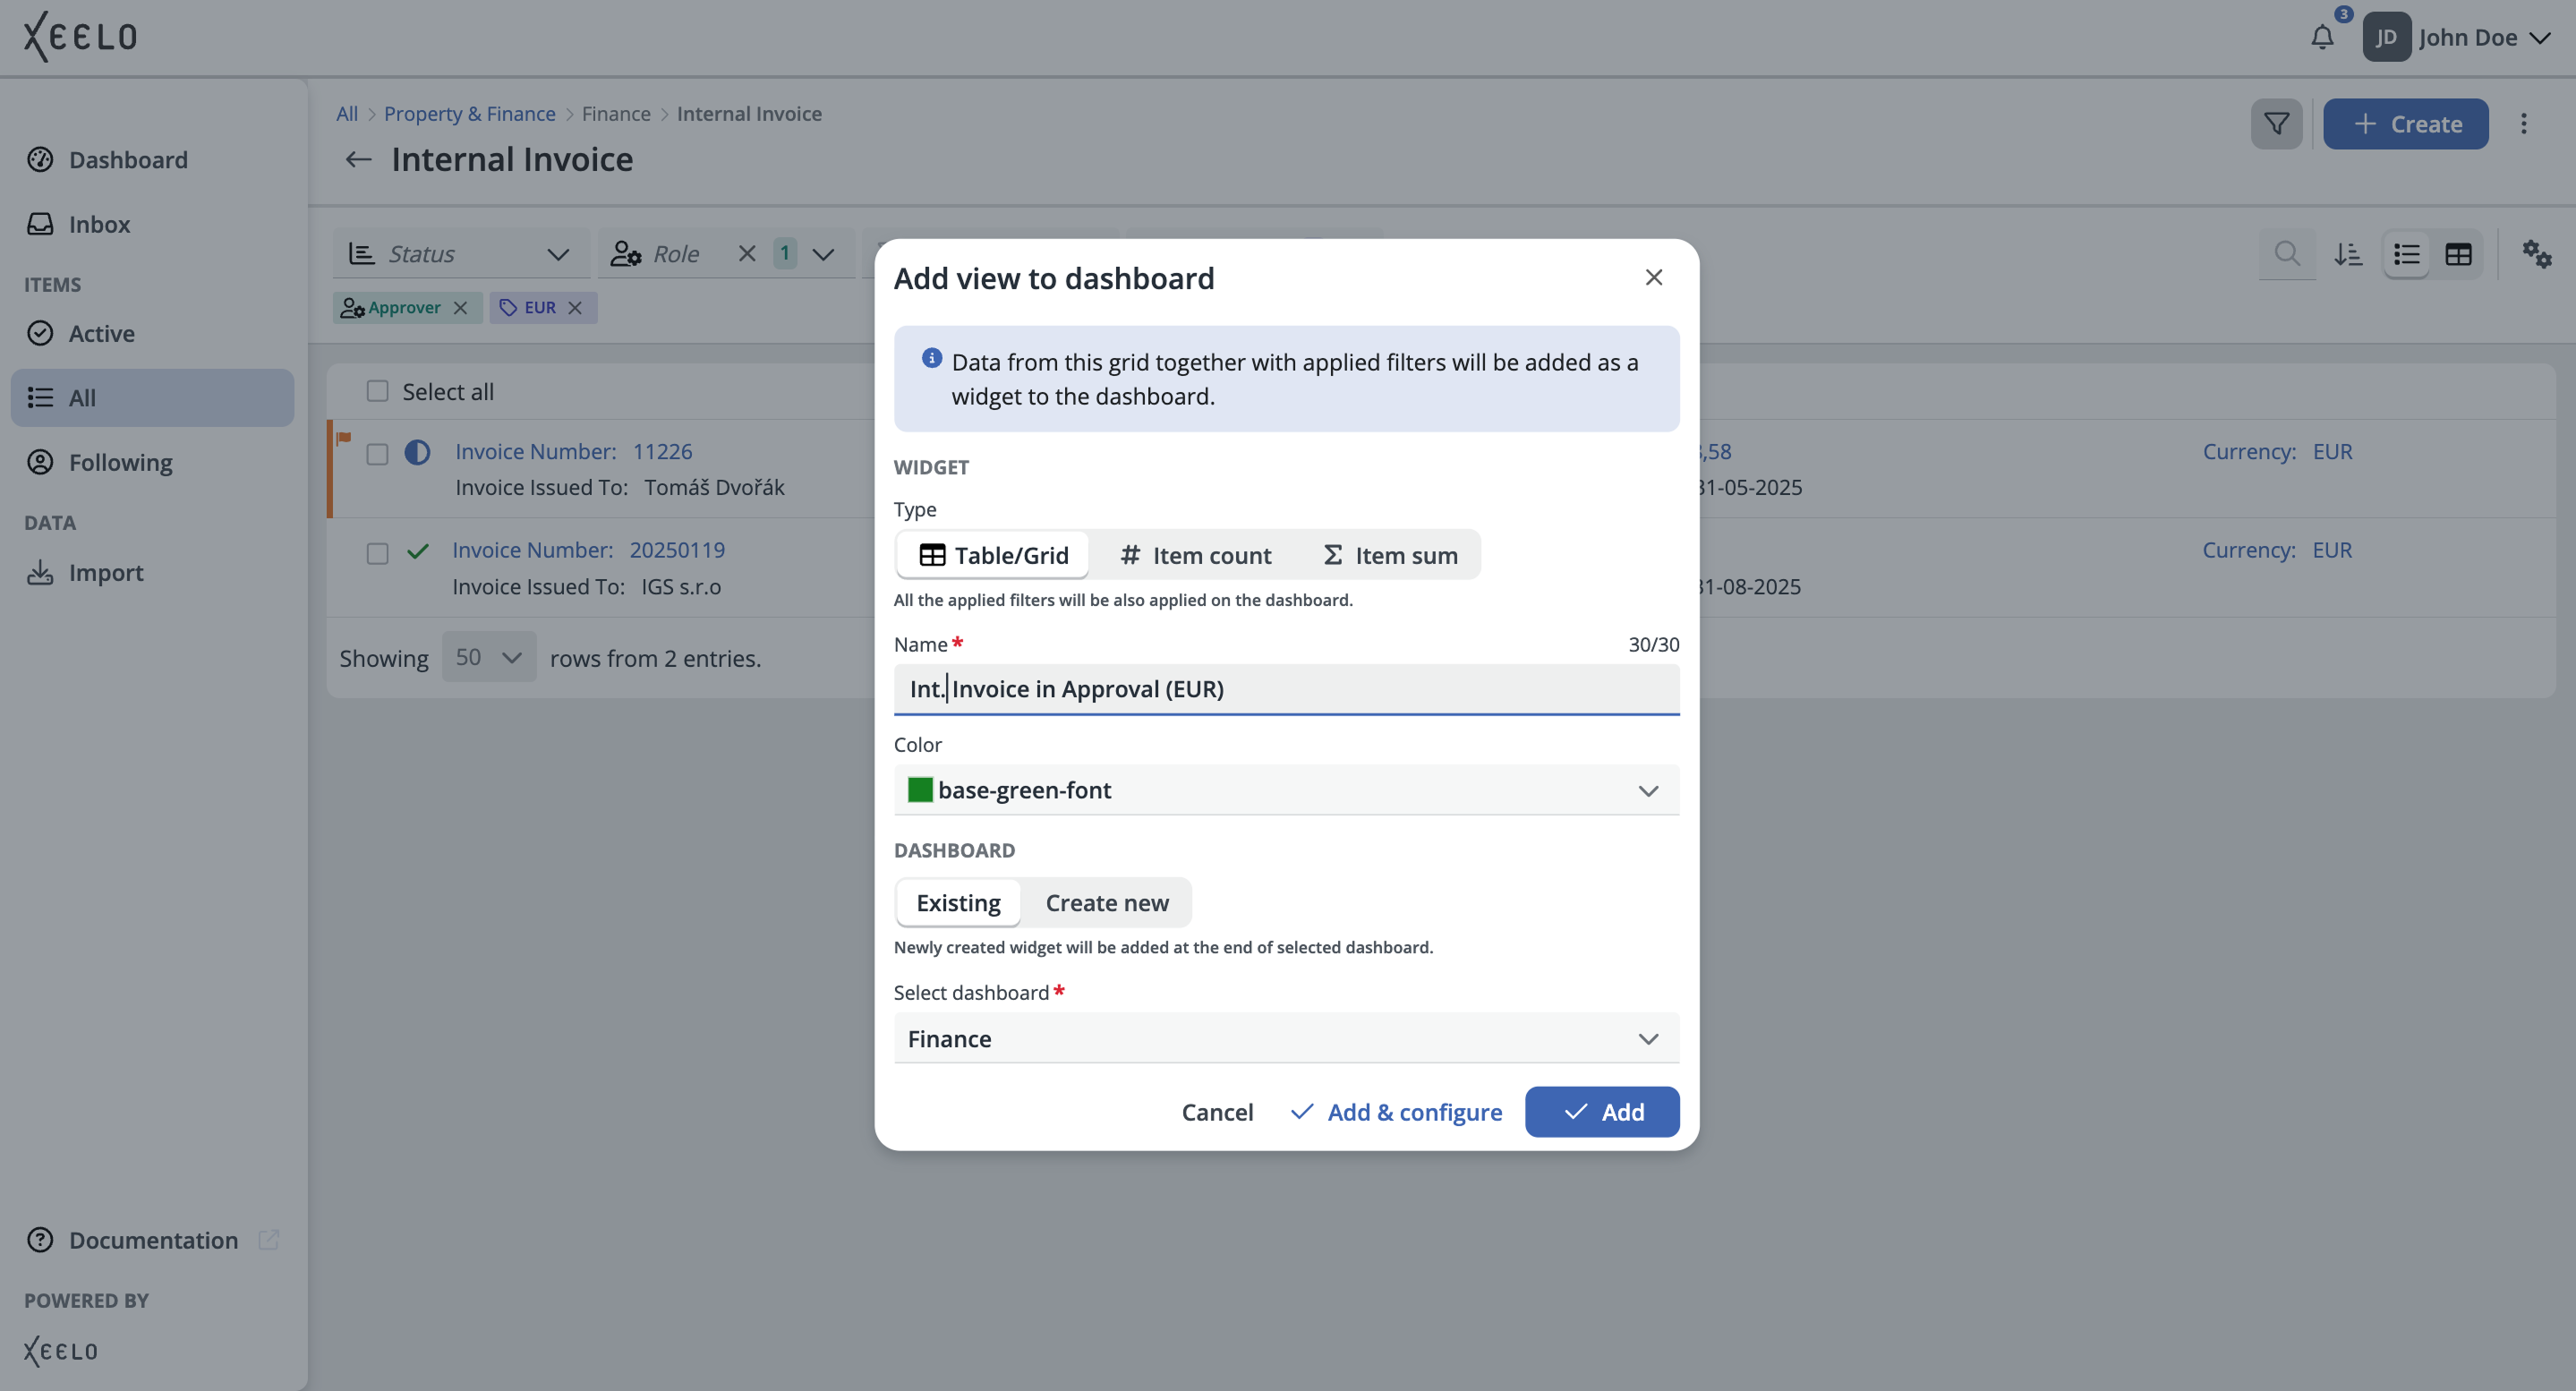
The currently used filters and overview settings are automatically transferred into the widget. This means you do not need to configure everything manually again. You can then immediately add the widget to an existing dashboard or create a new one directly. More information about creating widgets directly from the request overview is available here.